XABCD Trading
The ETP4 Pattern: Mastering Support and Resistance in Trading

Trading involves various strategies and techniques, with one of the most effective being the identification and utilization of chart patterns. Specifically XABCD Patterns as among these, the ETP4 pattern stands out due to its simplicity and reliability. When combined with the concepts of support and resistance, the ETP4 pattern can become a powerful tool in a trader's arsenal. So let's delve into the ETP4 pattern, explore how it aligns with areas of support and resistance, and provide actionable insights on how to trade using this pattern effectively.

Understanding the ETP4 Pattern
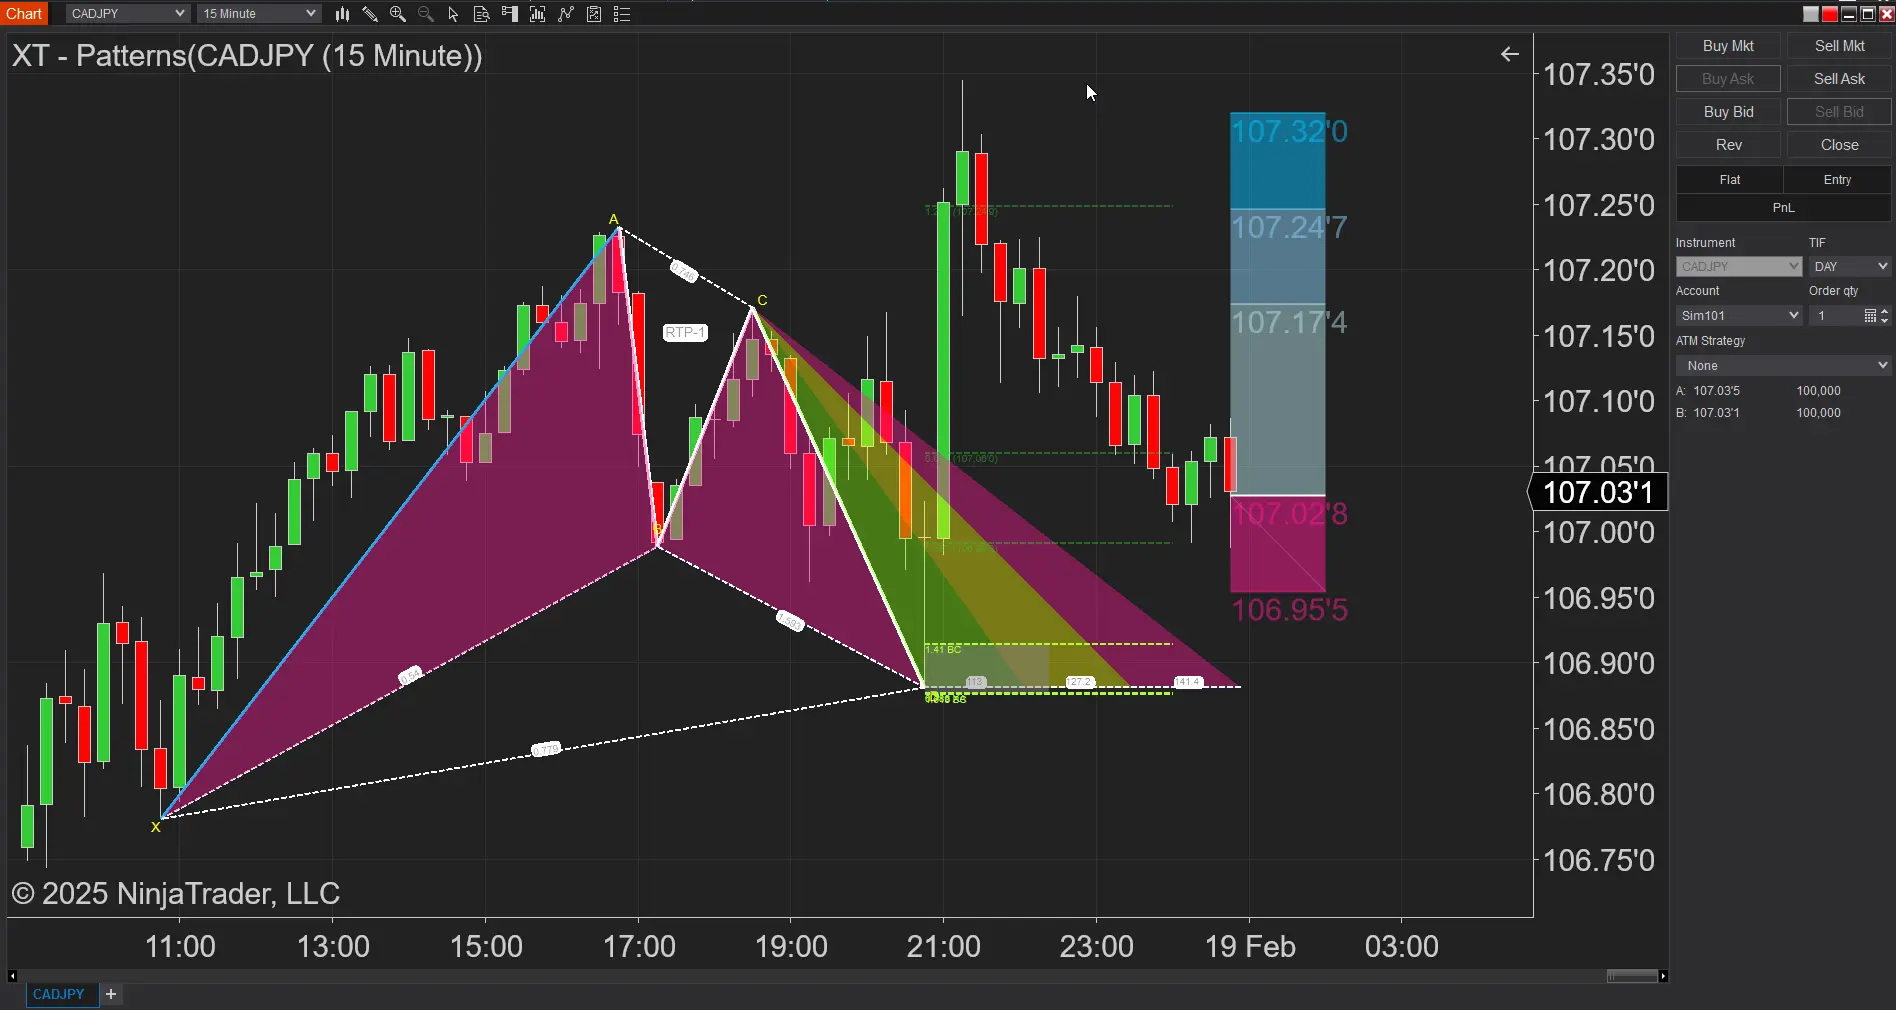
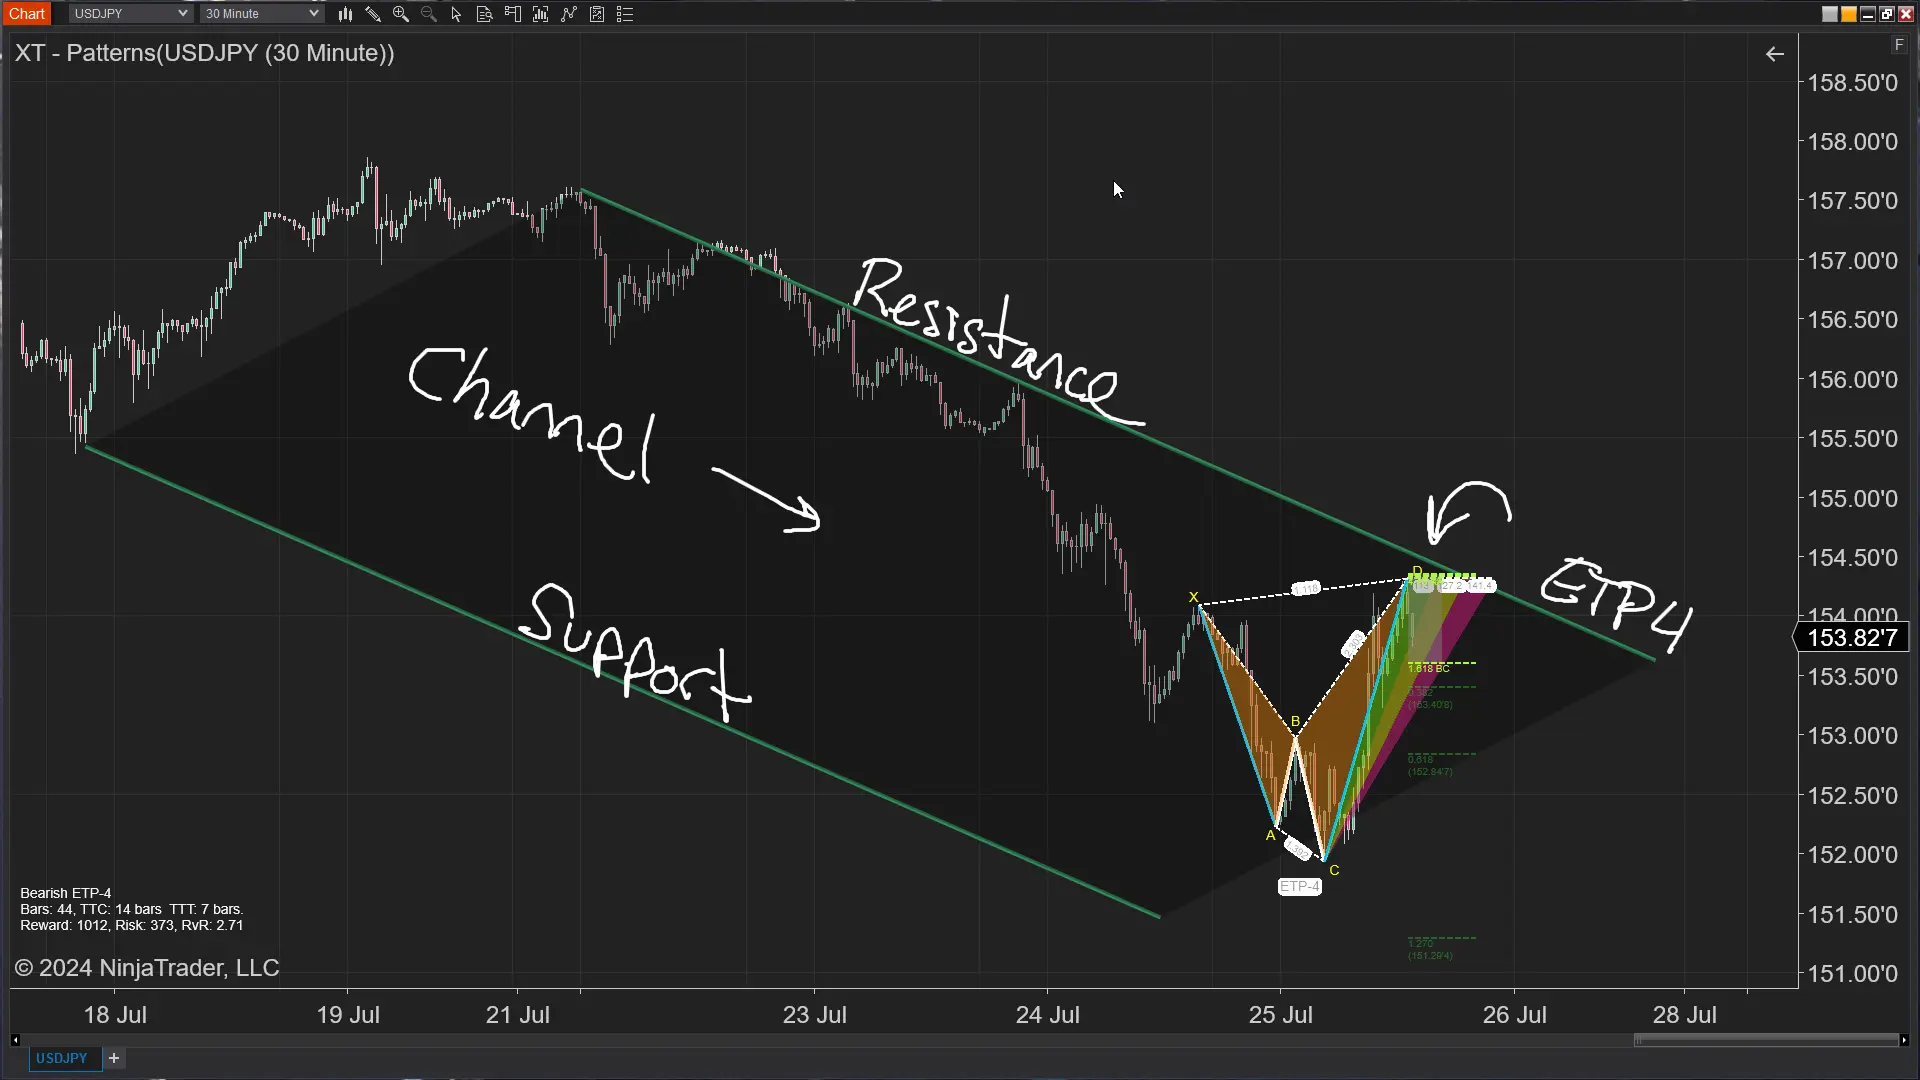
The ETP4 pattern, a lesser-known but highly effective trading pattern, is part of the XABCD pattern family. XABCD patterns are based on Fibonacci numbers and geometric price and time patterns, which help traders identify potential reversal points with high accuracy. The ETP4 pattern specifically consists of five points (X, A, B, C, and D) that form an identifiable shape on the chart, resembling a series of peaks and troughs. Using time with the Fibonacci measurements gives you a much greater consistency with the patterns.
The ETP4 pattern can be bullish or bearish, depending on its formation and the market trend. In a bullish ETP4 pattern, the price movement forms a series of higher lows and higher highs, indicating an upward trend. The time measurements are there to make sure that each wave takes enough time to build. Conversely, in a bearish ETP4 pattern, the price movement forms lower highs and lower lows, indicating a downward trend as the time measurements maintain consistency.
Key Components of the ETP4 Pattern
To trade the ETP4 pattern effectively, it's crucial to understand its key components:
- X Point: The initial point in the pattern, marking the start of the price movement.
- A Point: The first significant price movement from the X point, usually forming a peak or trough.
- B Point: A retracement from the A point, typically around 38.2% to 61.8% of the XA leg.
- C Point: A movement in the same direction as the XA leg but shorter, usually retracing around 38.2% to 88.6% of the AB leg.
- D Point: The final point in the pattern, forming the potential reversal zone (PRZ). This is the most critical point and is often found using Fibonacci extensions and projections.
The Role of Support and Resistance
Support and resistance are fundamental concepts in technical analysis. Support refers to a price level where a downtrend can be expected to pause due to a concentration of demand. Resistance, on the other hand, is a price level where an uptrend can be expected to pause due to a concentration of supply. These levels are critical because they represent the points at which the market psychology and the balance of supply and demand can shift, leading to potential reversals or continuations in price movements.
Why Combine the ETP4 Pattern with Support and Resistance?
Combining the ETP4 pattern with support and resistance levels enhances its effectiveness and reliability. Here’s why:
- Enhanced Accuracy: The confluence of an ETP4 pattern and a support or resistance level increases the likelihood of a successful trade. These areas act as confirmation zones, validating the potential reversal indicated by the pattern.
- Clear Entry and Exit Points: Support and resistance levels provide clear entry and exit points, reducing ambiguity in trading decisions. When the ETP4 pattern aligns with these levels, it offers precise areas to enter or exit trades.
- Risk Management: Incorporating support and resistance levels into your ETP4 pattern trading strategy allows for better risk management. These levels help set logical stop-loss and take-profit targets, minimizing potential losses and maximizing gains.
Identifying the ETP4 Pattern
Years ago the ETP4 pattern would have required rulers and a long process of 11 fibonacci measurements to make sure the pattern even existed. Today, we use the XACBD Scanner to alert us to these new opprotunities.
Why Combine the ETP4 Pattern with Support and Resistance?
Combining the ETP4 pattern with support and resistance levels enhances its effectiveness and reliability. Here’s why:
- Run the Market Analyzer: Open your Market Analyzer in NinjaTrader 8 and load up the XABCD Pattern scanner template included with our XABCD Pattern Suite
- Alerting: If your using our default workspace, your alerting is all setup and you will start to get alerts for the pattenrs that are identified.
- Trade: The next step would be to make sure the pattern fits your execution plan and then to take the trade.
Trading the ETP4 Pattern with Support and Resistance
Now that we understand the ETP4 pattern and the importance of support and resistance, let’s explore how to trade this pattern effectively.
Step by Step - ETP4 with Support and Resistance
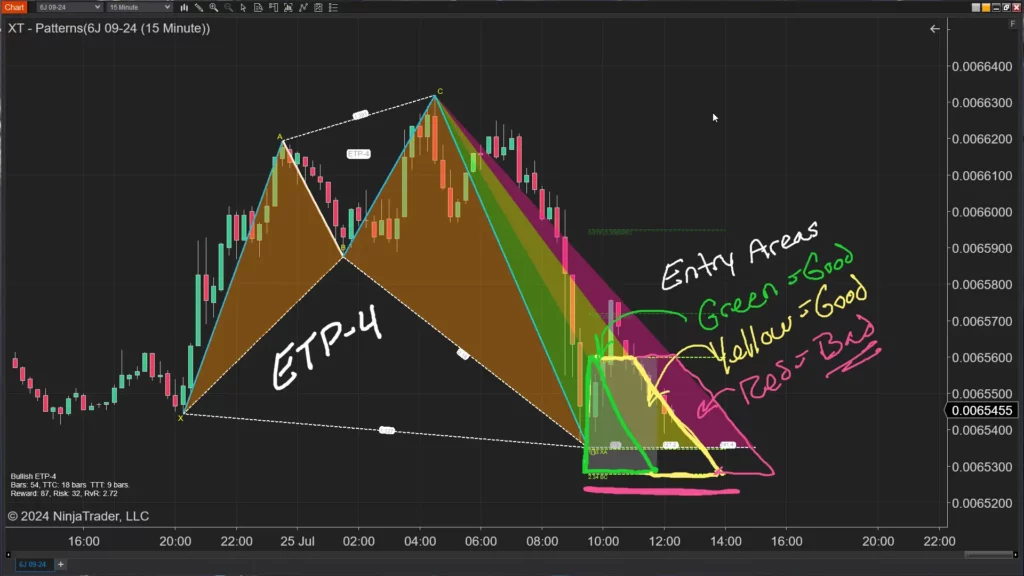
- Identify Key Support and Resistance Levels: Before trading the ETP4 pattern, identify key support and resistance levels on the price chart. These levels can be horizontal lines, trendlines, or dynamic levels such as moving averages.
- Look for Confluence: Search for areas where the ETP4 pattern aligns with these support and resistance levels. Confluence enhances the reliability of the pattern and increases the probability of a successful trade.
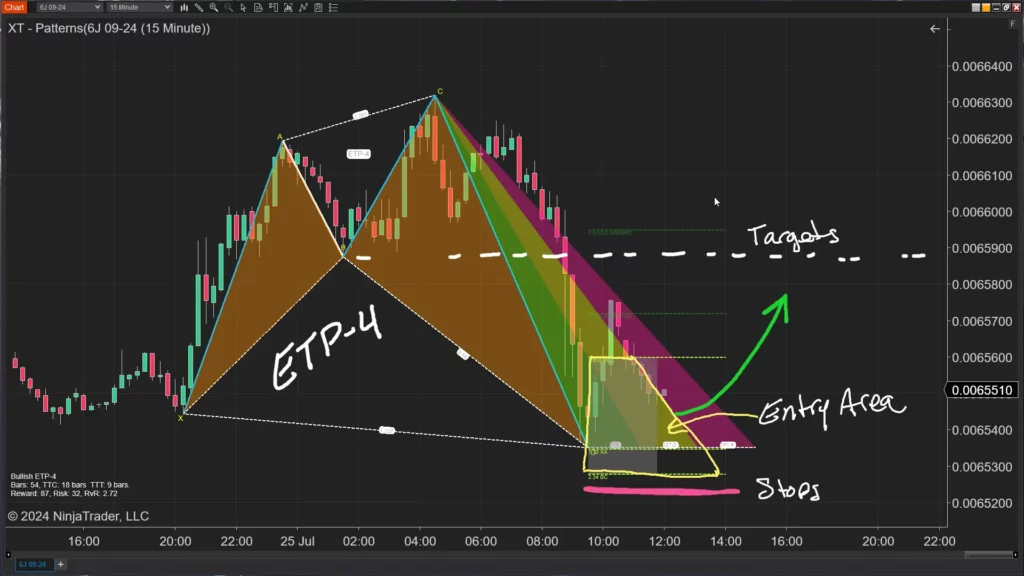
- Enter the Trade: Once you identify a valid ETP4 pattern at a key support or resistance level, enter the trade. In a bullish ETP4 pattern, enter a long position at the support level. In a bearish ETP4 pattern, enter a short position at the resistance level.
- Set Stop-Loss Orders: Place stop-loss orders below the support level in a bullish pattern or above the resistance level in a bearish pattern. This helps manage risk and limit potential losses.
- Determine Take-Profit Targets: Use Fibonacci extensions, previous price highs or lows, or other technical indicators to set take-profit targets. Having a clear exit strategy is essential for maximizing profits.
- Monitor the Trade: Continuously monitor the trade and adjust stop-loss orders to break even or trail profits as the price moves in your favor. This ensures that you protect your gains and minimize losses.
Advantages of Trading the ETP4 Pattern
Trading the ETP4 pattern offers several advantages:
Why Use the ETP4? It's Simple...
The ETP4 pattern, when combined with support and resistance levels, provides high-probability trading opportunities. Its structure and alignment with these levels offer clear entry and exit points, reducing ambiguity in trading decisions. Incorporating support and resistance into the trading strategy also enhances risk management by establishing logical stop-loss and take-profit targets.
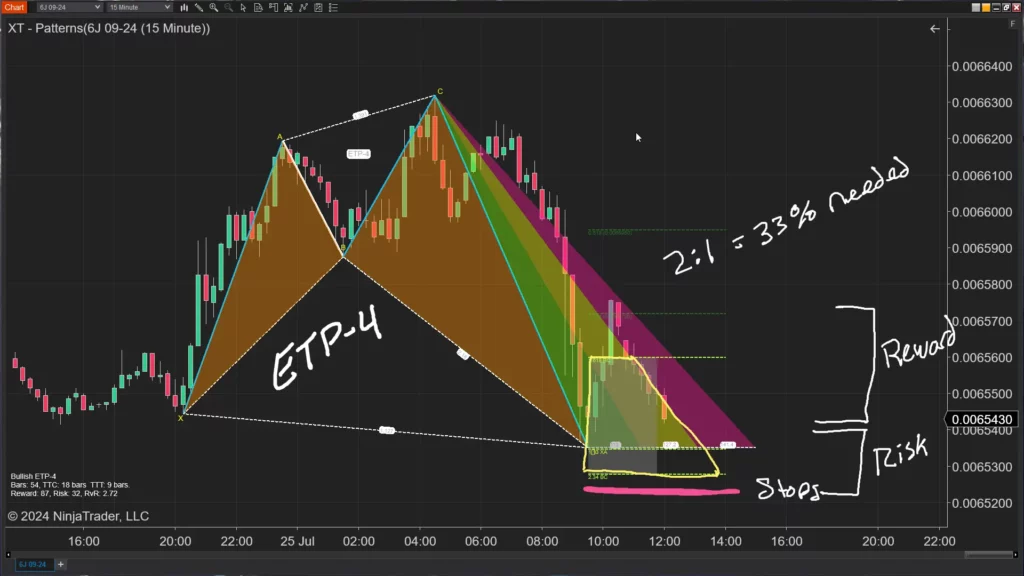
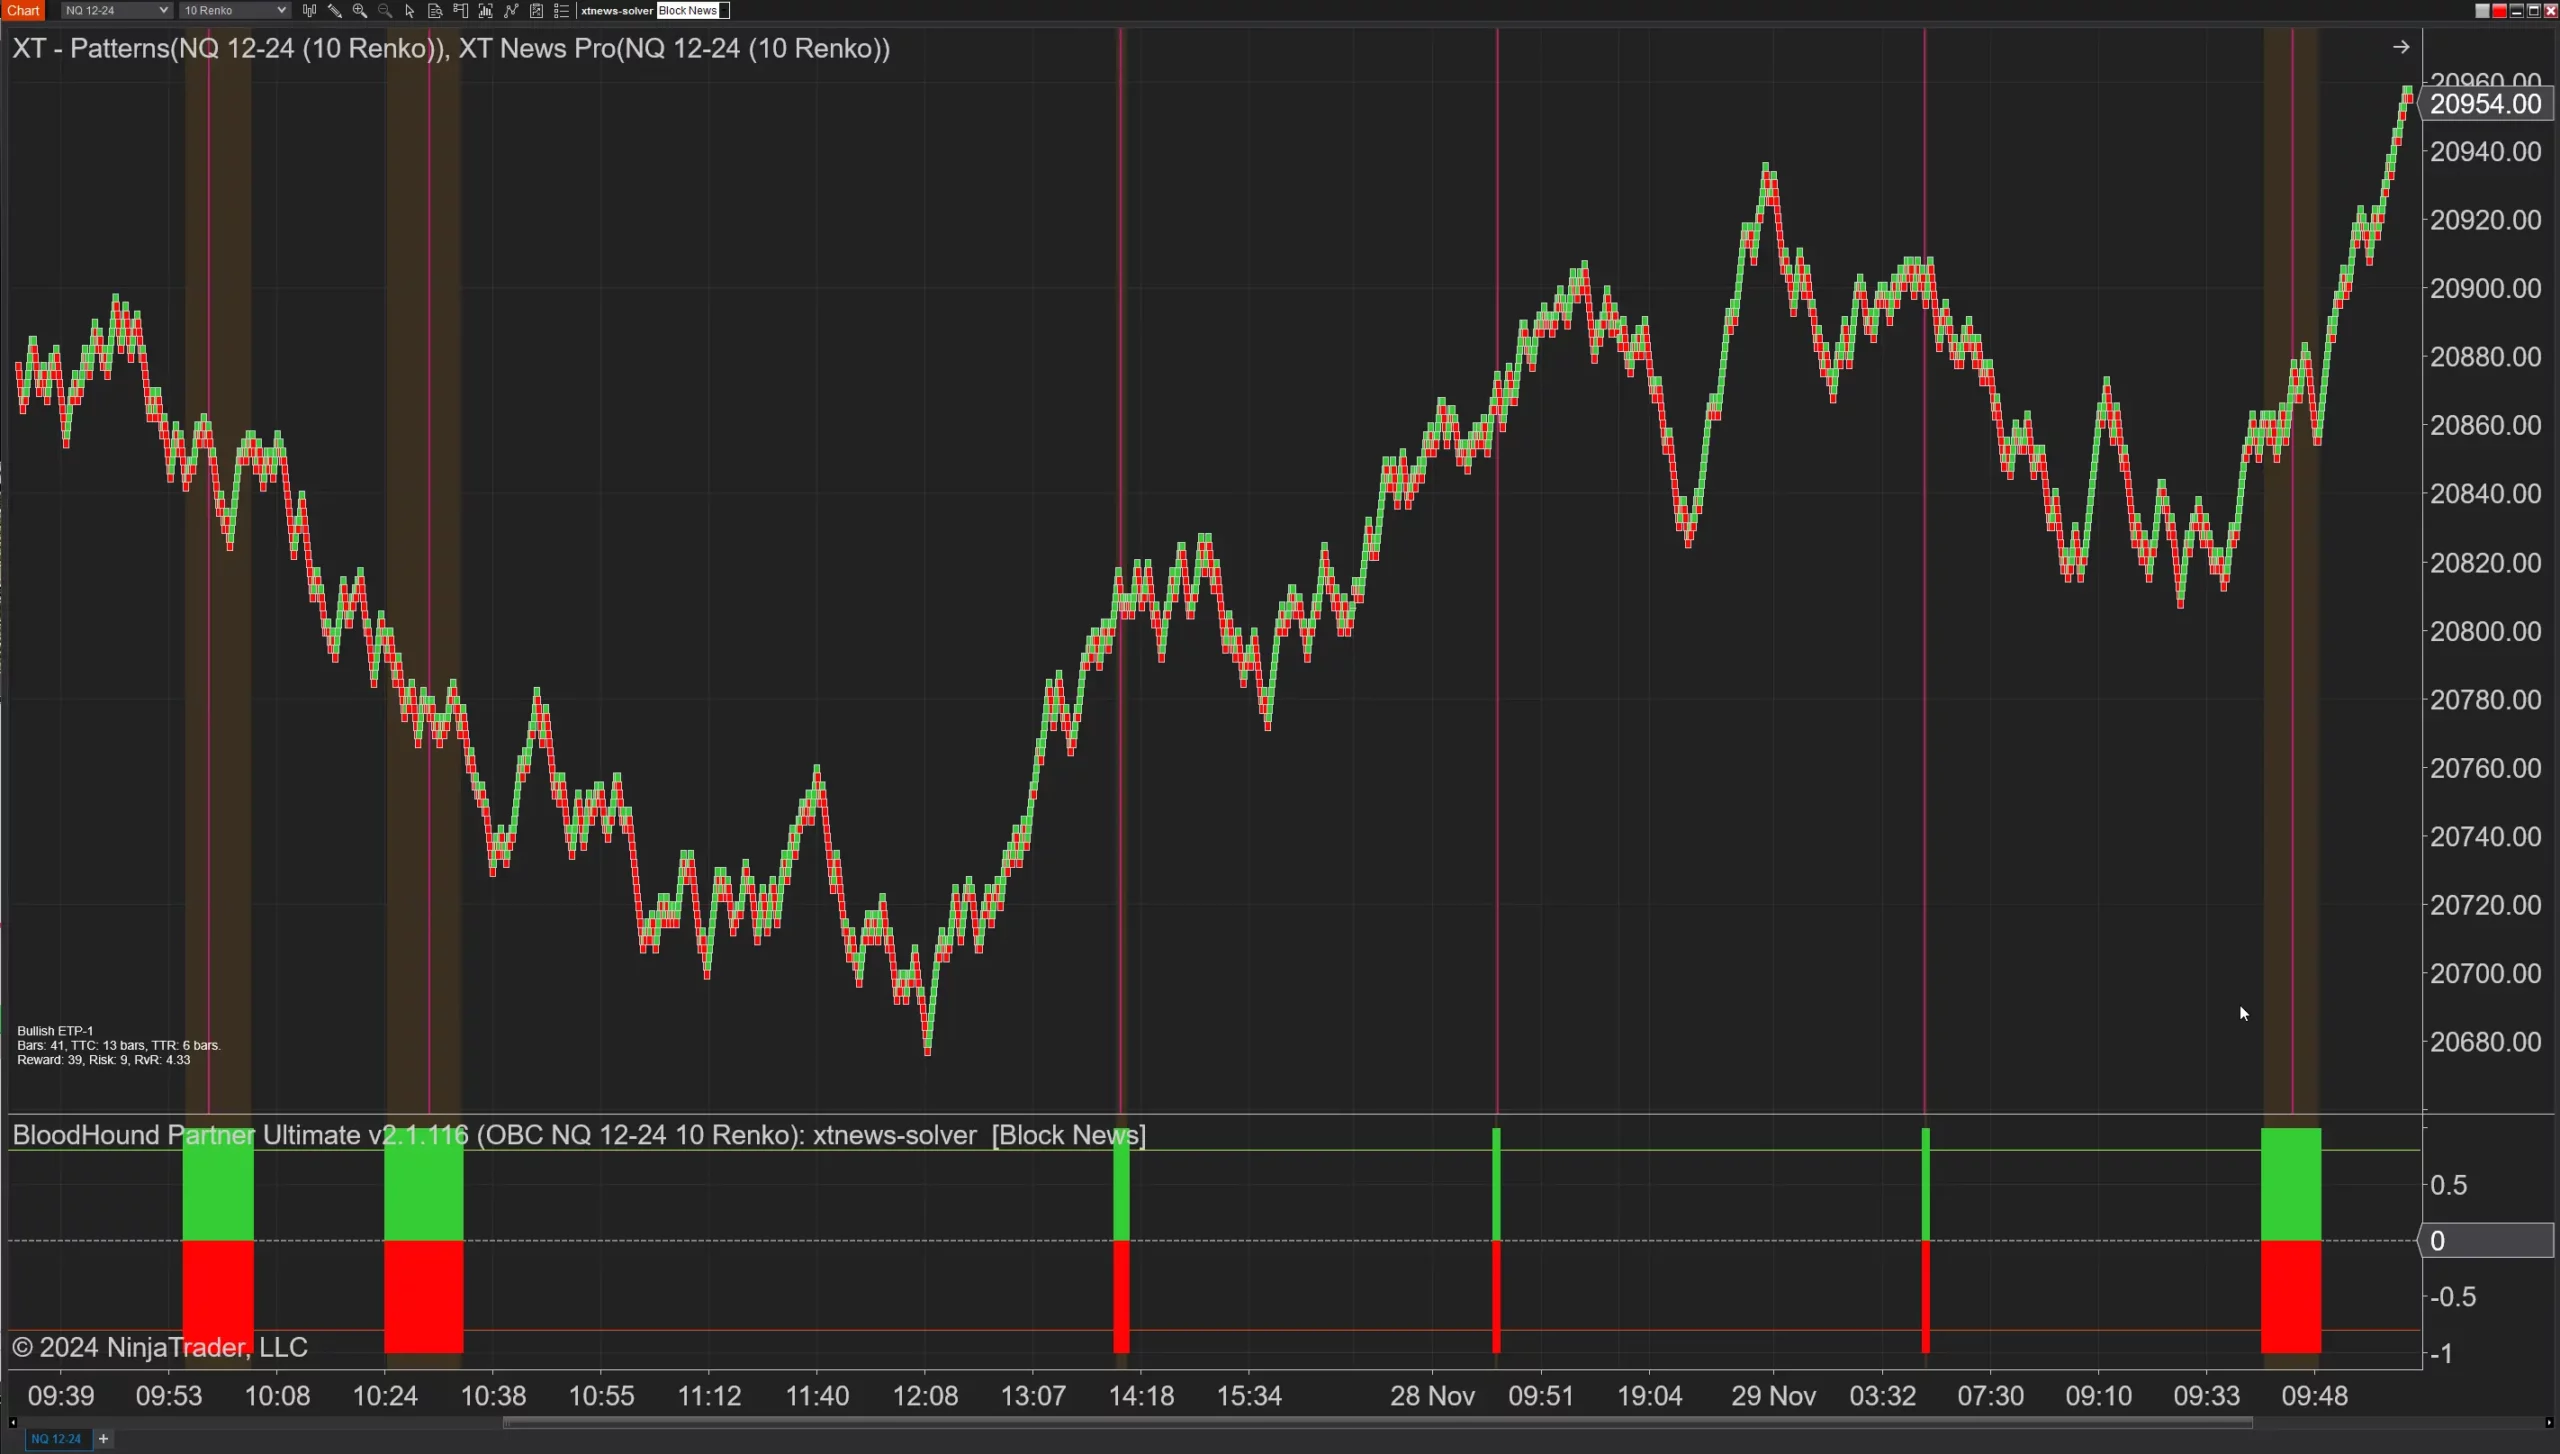
Additionally, the ETP4 pattern can provide a good risk vs reward ratio. If you looked for all patterns that had a 2:1 risk vs reward, you would have to be right 33% of the time to breakeven.
Challenges and Considerations
Trading the ETP4 pattern offers several advantages:
- Pattern Identification: Identifying the ETP4 pattern accurately requires practice and experience. Traders should familiarize themselves with the pattern’s structure and characteristics.
- Market Conditions: The effectiveness of the ETP4 pattern can vary depending on market conditions. Traders should consider the broader market context and avoid trading in choppy or low-volatility environments.
- Psychological Discipline: Trading requires psychological discipline and patience. Traders should adhere to their trading plans, manage their emotions, and avoid impulsive decisions. This can be hard for newer traders, however the patterns will keep you much more disciplined since they have black and white rules.
Apr. 06, 2025
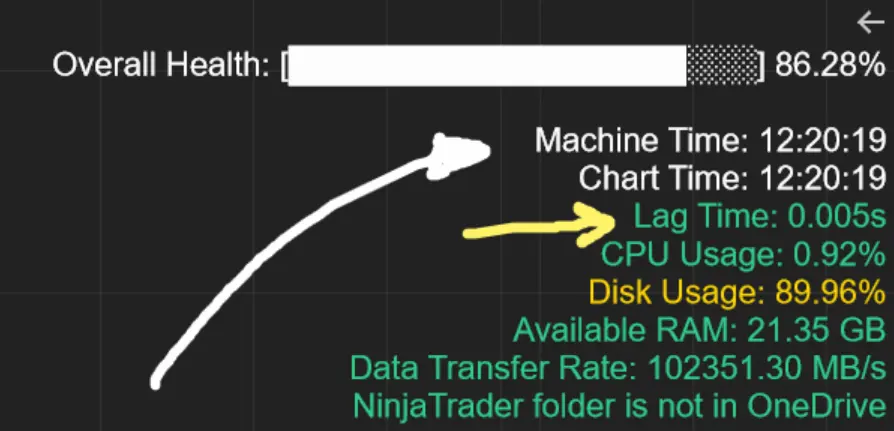
From Lag to Lightning: The Critical Role of Read/Write Speeds in NinjaTrader 8
Mar. 08, 2025
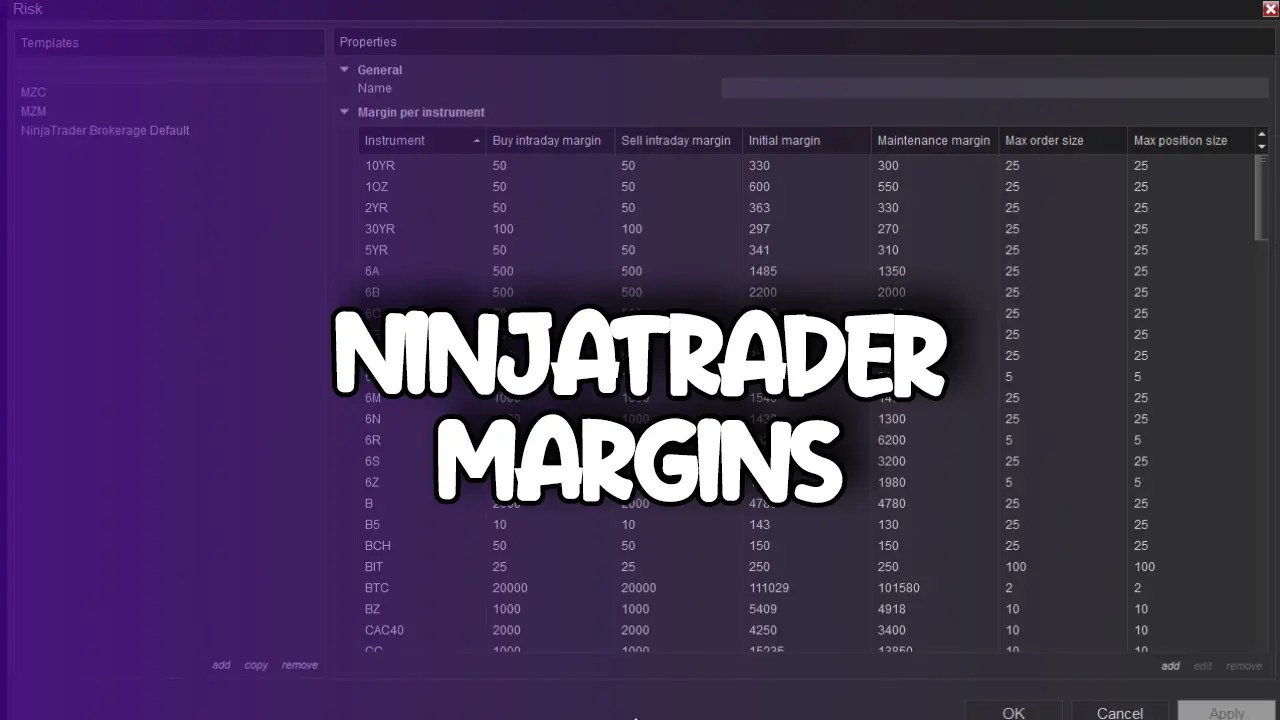
NinjaTrader Margins Requirements for Futures Trading

Mar. 05, 2025
Order Rejected at RMS Meaning in NinjaTrader
Feb. 19, 2025
Boost Your Trading Efficiency: New Automated Order Quantity Feature for Seamless Position Management

Dec. 30, 2024
Are XABCD Patterns Still Useful in 2025?
Nov. 30, 2024
Aligning Time-Based Events with Non-Time-Based Charts for News Events in NinjaTrader 8
Nov. 11, 2024
Avoiding Costly Delays: How the XABCD Performance Indicator Identifies Lag Issues in Real-Time

Oct. 26, 2024
NinjaTrader 8 & One Drive Woes? Follow these steps.

Aug. 10, 2024
NinjaTrader and Evaluation Accounts: What You Need to Know
Jul. 25, 2024
The ETP4 Pattern: Mastering Support and Resistance in Trading

Learn the XABCD Pattern Strategy in Under 2 Minutes

Take A Tour of Our Pattern Indicators

How to Find Better XABCD Patterns

XABCD News (Free Version)
XABCD News (Community Edition) is the best free Indicator for NinjaTrader 8. Don't let news sneak up on you again. Puts economic news events on your charts so you can stay informed and move around positions/stops before the news is released. Works in any market.
XABCD Priceline (Free)
XABCD Price Line tool for NinjaTrader 8 will draw a line at current price and move every time the market changes price. This is useful because it will allow you to easily identify where price is at all times and the exact quoted price.