XABCD TRADING
Aligning Time-Based Events with Non-Time-Based Charts for News Events in NinjaTrader 8
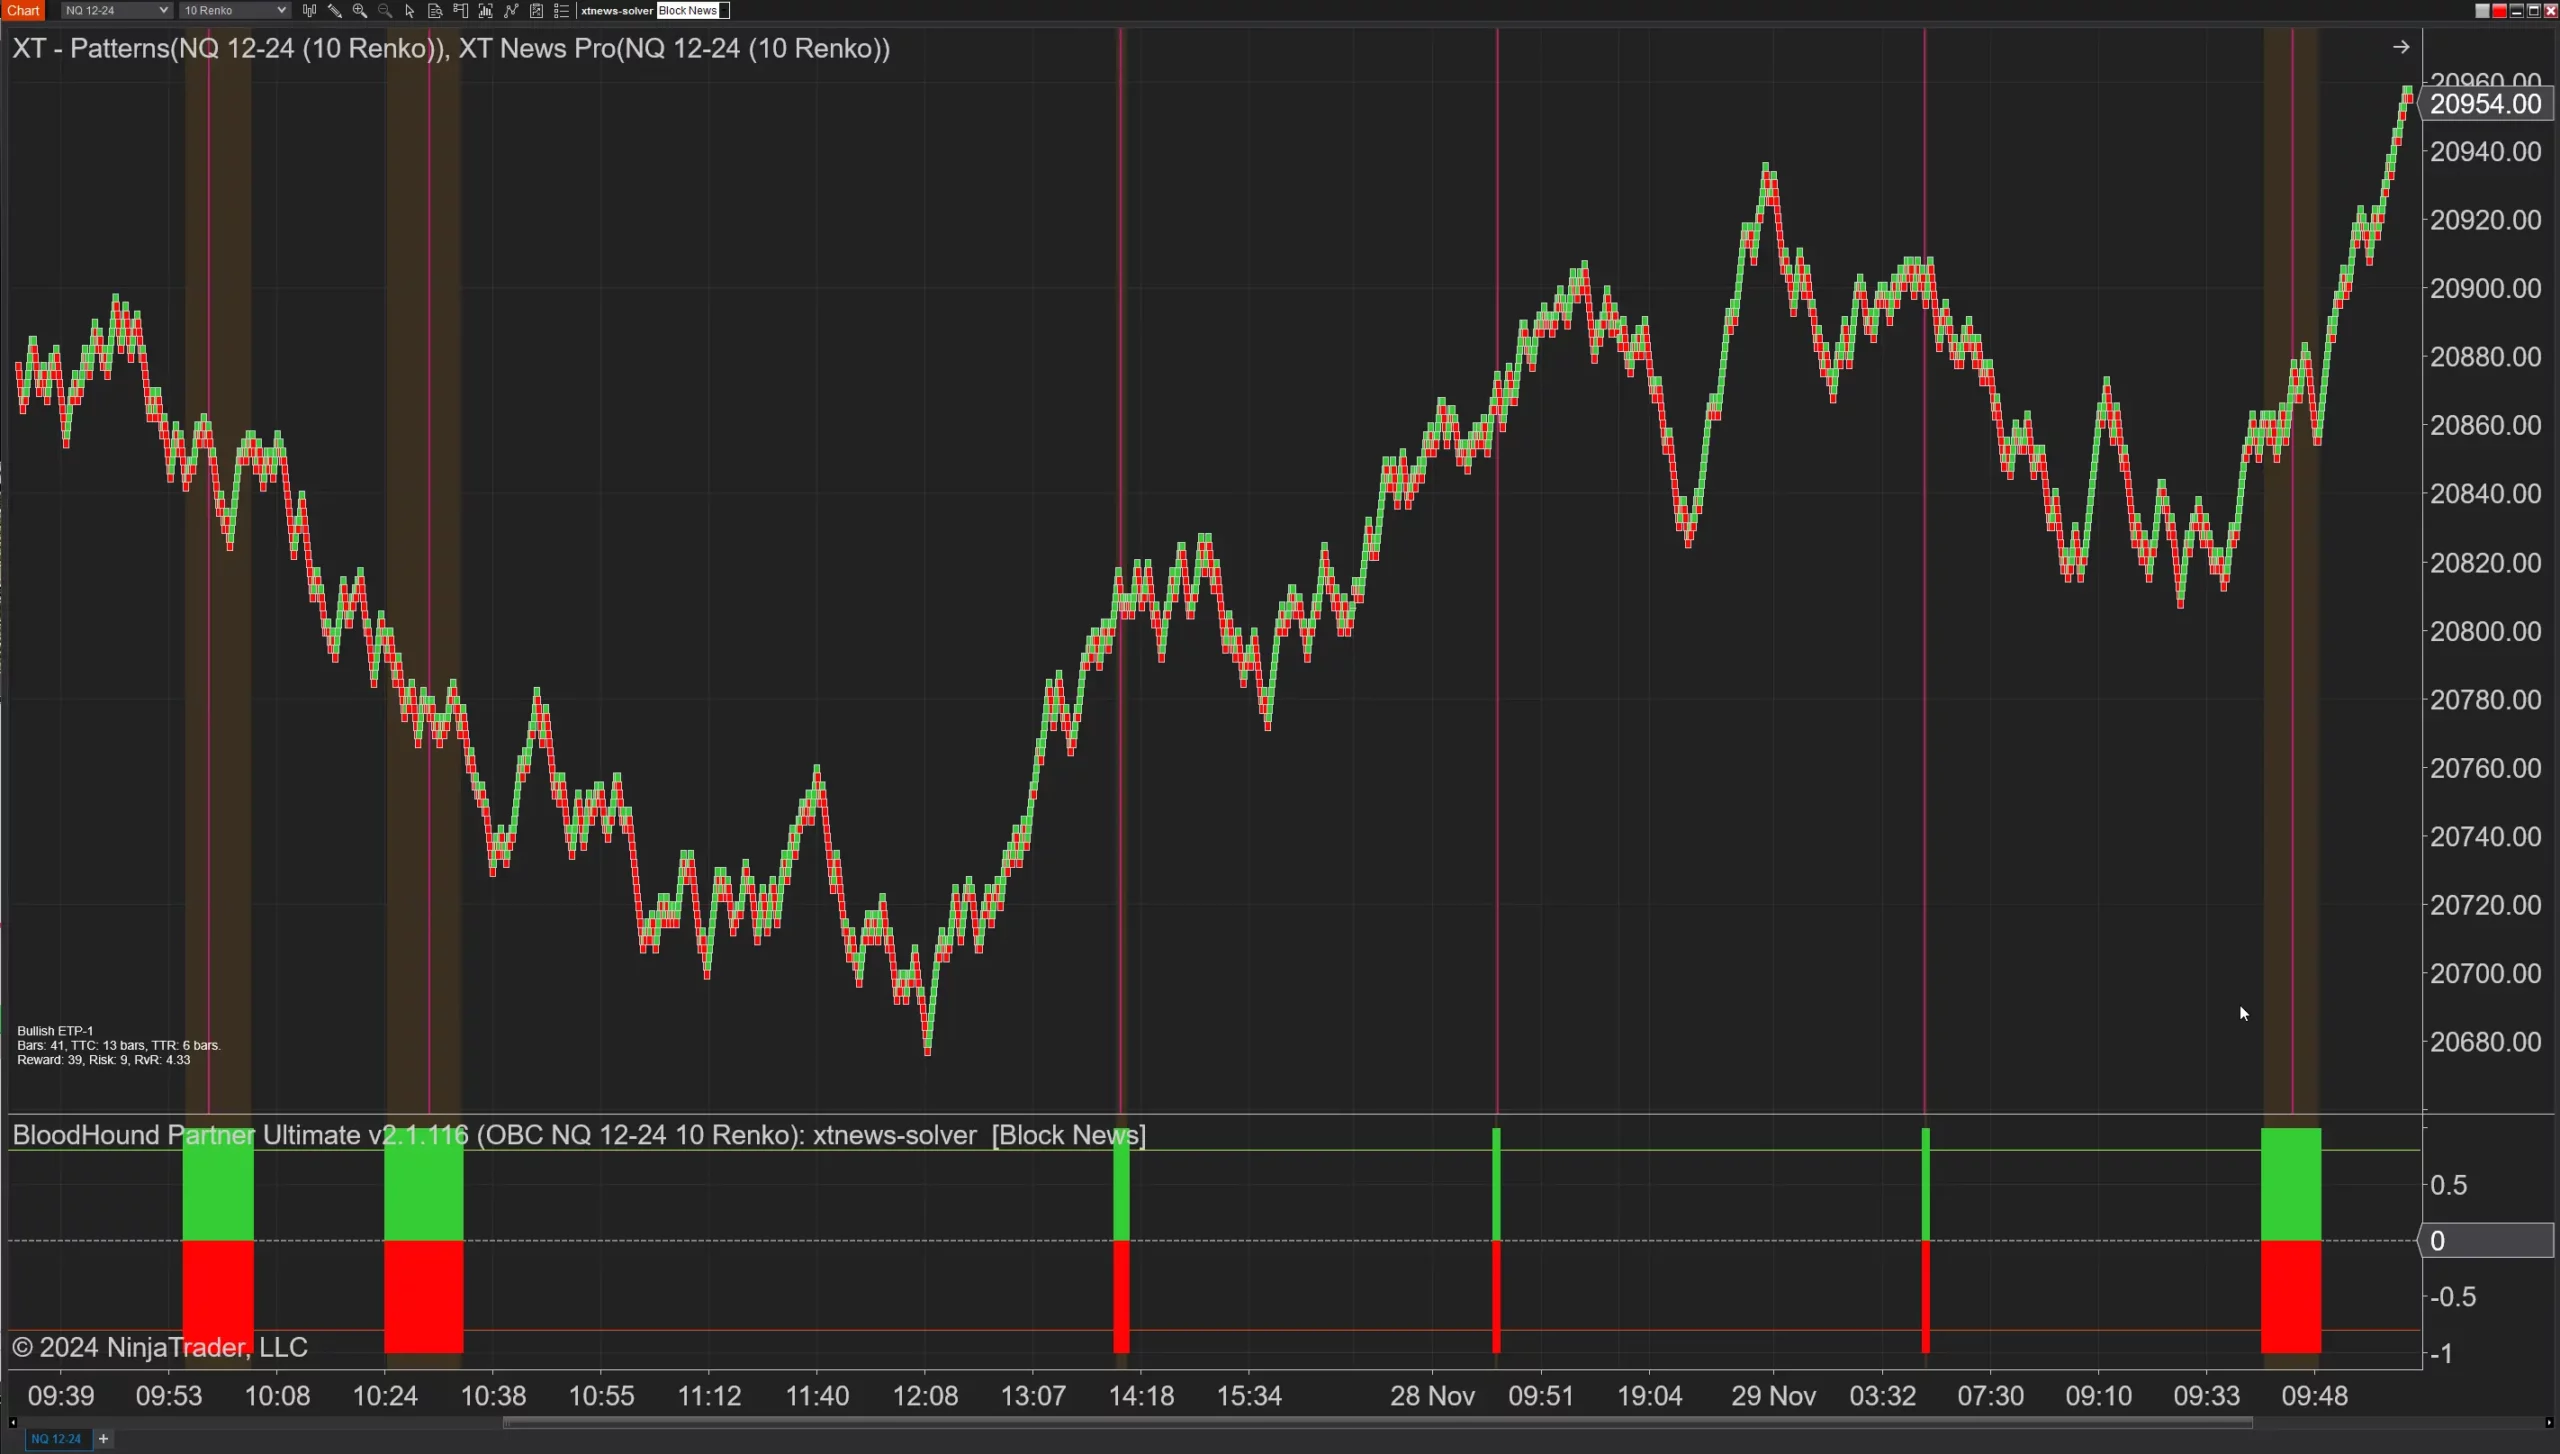
Non-time-based charts, such as Renko, Range, Tick, and Volume charts, are powerful tools for analyzing price movement without the constraints of fixed time intervals. Unlike traditional time-based charts (e.g., 1-minute or daily charts), these chart types are built around specific criteria like price changes, transaction volumes, or tick counts. This flexibility provides unique insights but introduces challenges when attempting to map time-based data, such as economic news events, onto the chart.
In this blog post, we'll explore how to align time-based events with non-time-based charts effectively.
The Unique Nature of Non-Time-Based Bars
Non-time-based charts do not rely on a fixed time interval for creating bars. Instead, they depend on specific conditions, such as:
- Price movement thresholds (e.g., Renko or Range charts)
- Number of trades (e.g., Tick charts)
- Volume of transactions (e.g., Volume charts)
As a result:
- A single bar might span seconds, minutes, hours, or even days, depending on market activity.
- The lack of a strict DateTime per bar creates challenges when trying to correlate time-specific events like news announcements or economic reports with chart data.
Anchoring Events Without Time
In the absence of strict timestamps for each bar, non-time-based charts rely on bar indices as an anchoring mechanism. Each bar is assigned a sequential index based on the order of its creation:
- Bar 0: The most recent (active) bar.
- Bar 1: The second most recent bar.
- Negative indices (e.g., Bar -1, Bar -2) represent projected future bars in some systems.
These indices serve as the foundation for aligning external time-based data with the chart.
Approximate Time Windows for Bars
Although non-time-based bars do not inherently have timestamps, they can still be loosely associated with a time range:
- Start Time: The time the previous bar was completed.
- End Time: The time the current bar was completed (or will be completed).
For example, a Renko bar may represent the time range during which the price moved sufficiently to meet the brick size threshold. Similarly, a Volume bar spans the time it takes to reach the specified volume of transactions.
Mapping Time-Based Events to Non-Time-Based Charts (Made Simple)
Aligning time-based events, like news announcements, with non-time-based charts can seem tricky at first. These charts don’t follow a strict timeline like traditional charts. Instead, bars appear when specific conditions, such as price movement or trade volume, are met. Here’s how you can make the connection between the two:
Finding the Right Bar for an Event
Locate the Closest Match: Start by identifying the bar that was most recently completed before the event happened. Think of it as finding the last "checkpoint" before the event. If the event happens between two bars, attach it to the bar that’s closest in time.
Make Adjustments if Necessary: Sometimes, no bar will line up perfectly with the event time. In those cases, you can approximate the position by looking at where it fits best on the chart.
For example: Imagine a news announcement occurs at 9:15 AM. On a chart based on the number of trades, the nearest bar might cover activity from 9:12 to 9:14. Even though it’s not an exact match, you can place the event marker just after this bar to show when it happened.
Then We Visualize These Events on Your Chart
Once you’ve determined the right spot for the event, it’s time to make it visible on your chart.
Add a Marker:
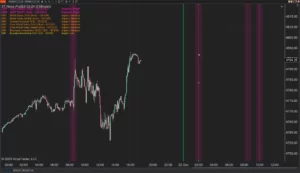
Use a vertical line or other marker to indicate where the event occurred. This makes it easy to see at a glance.
Provide Details:
Add labels or tooltips to explain what the event is, when it happened, and its significance. For example, “9:15 AM: Economic Report Released.”
Handle Low Activity Periods:
What do we do in this case? Well, if no bars were created during a slow market period when the event happened, place the marker in the nearest logical gap. Use a dashed line or similar visual cue to indicate it happened during a quiet time.
Best Practices for Displaying Events
When displaying events on your charts, it's important to be clear and consistent by using the same type of marker and placement for all events to maintain readability. Highlight significant events, such as major announcements, with bold markers or bright colors to make them stand out. Additionally, keep the broader context in mind, ensuring the chart still provides a clear view of market activity alongside the events for a balanced and informative presentation.
Let's Wrap It Up...
Non-time-based charts are fantastic for focusing on price movements, volume, or trades, but they require a bit of creativity when adding time-specific events. By finding the nearest bar, using clear markers, and adding helpful details, you can effectively integrate and visualize these events on your charts. This approach ensures that crucial information, like economic news, is always in view—helping you make better-informed trading decisions.
Sep. 28, 2025
NinjaTrader Risk Management That Actually Moves the Needle
Sep. 25, 2025
NinjaTrader 8.1.6 — The “No Fluff” Tour (Speed, Clarity, Fewer Clicks)
Sep. 20, 2025
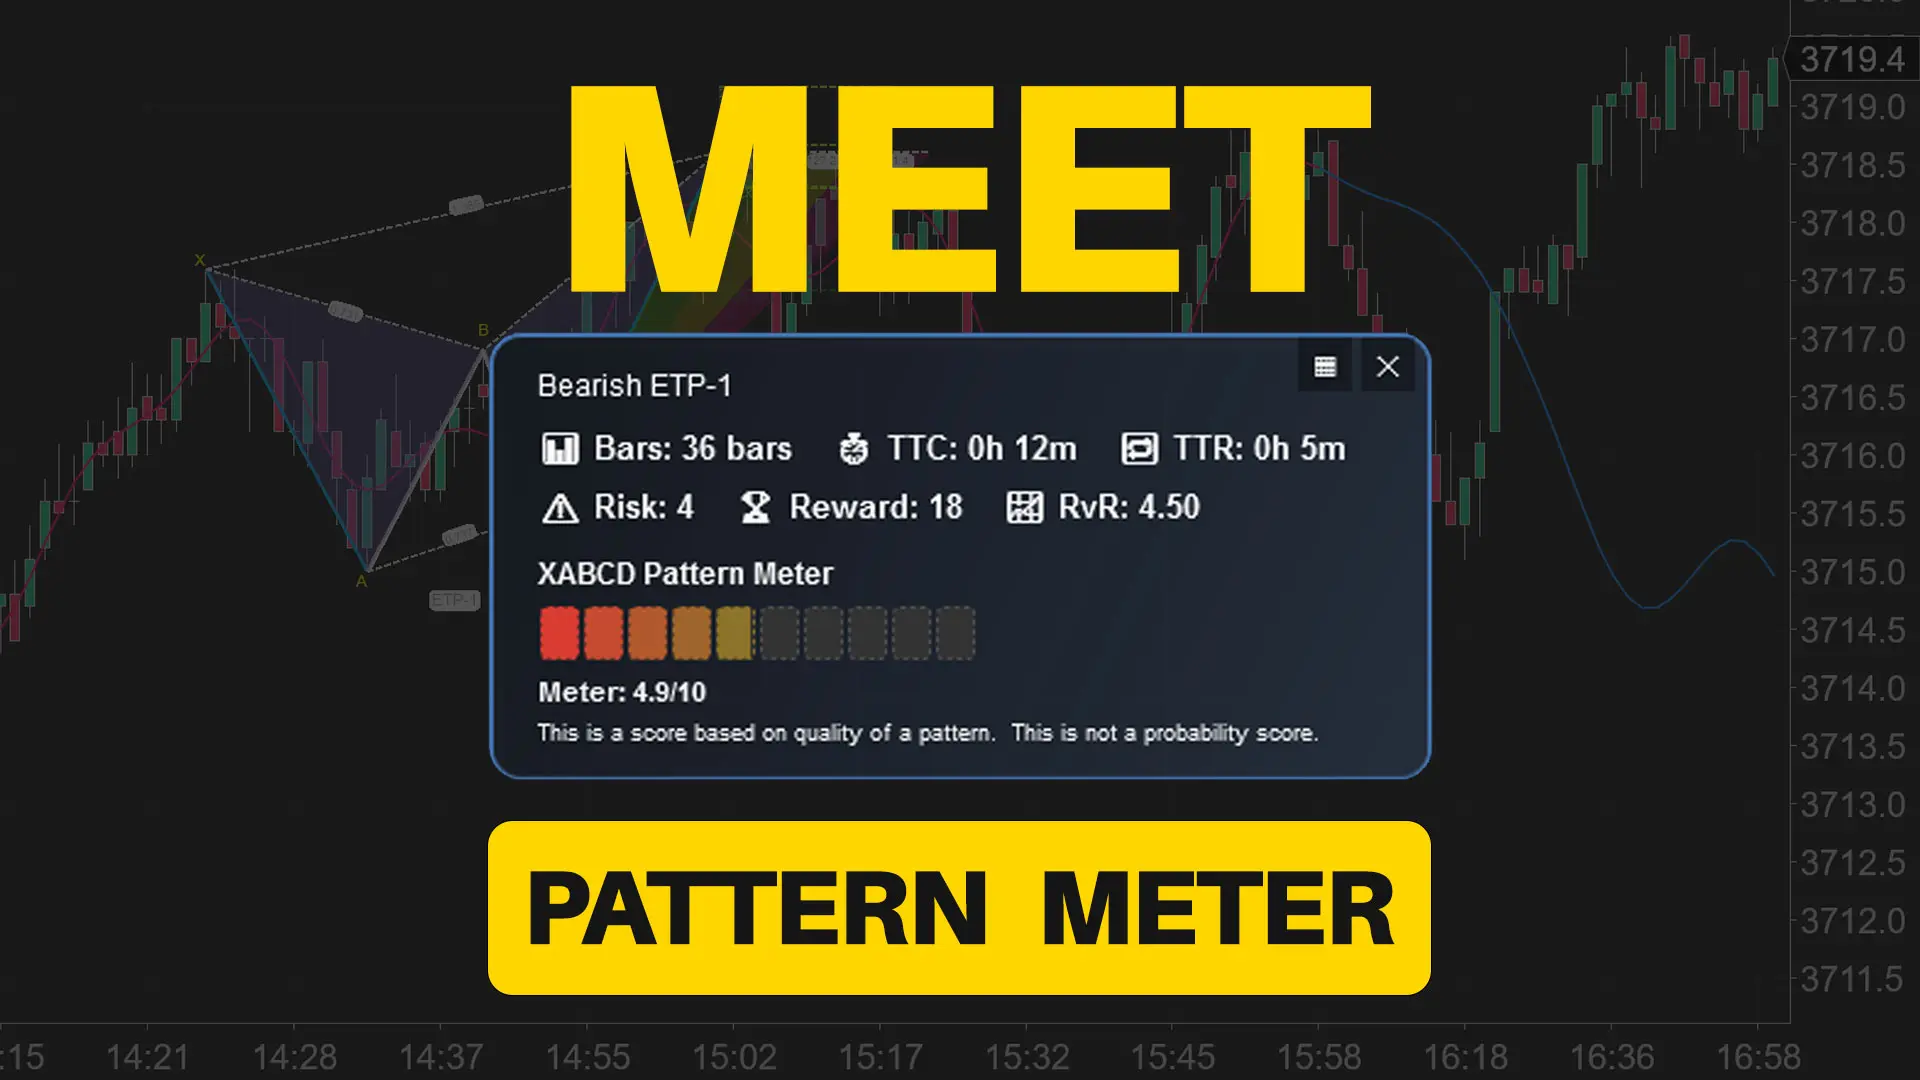
Meet the XABCD Pattern Meter (Real-Time Clarity)
Sep. 13, 2025
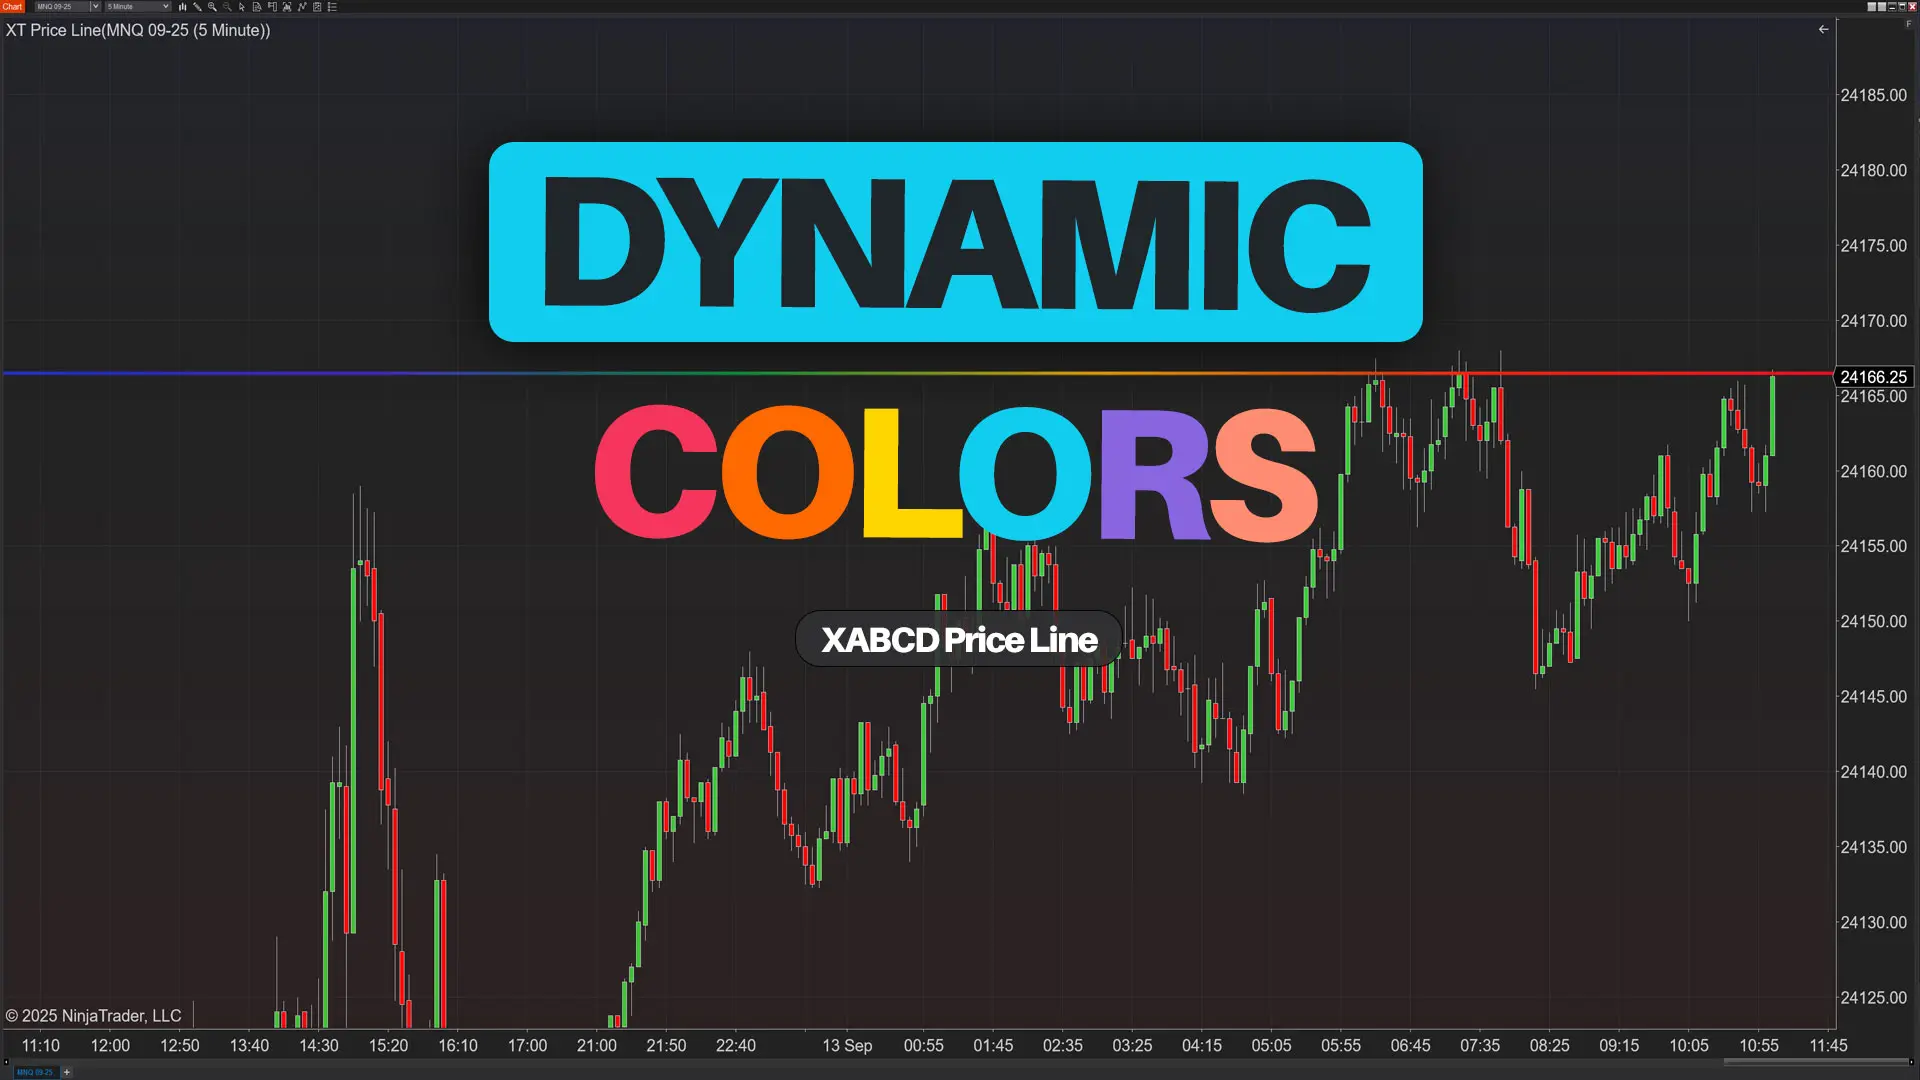
XT PriceLine: Dynamic Colors That Let You See Every Tick
Aug. 30, 2025
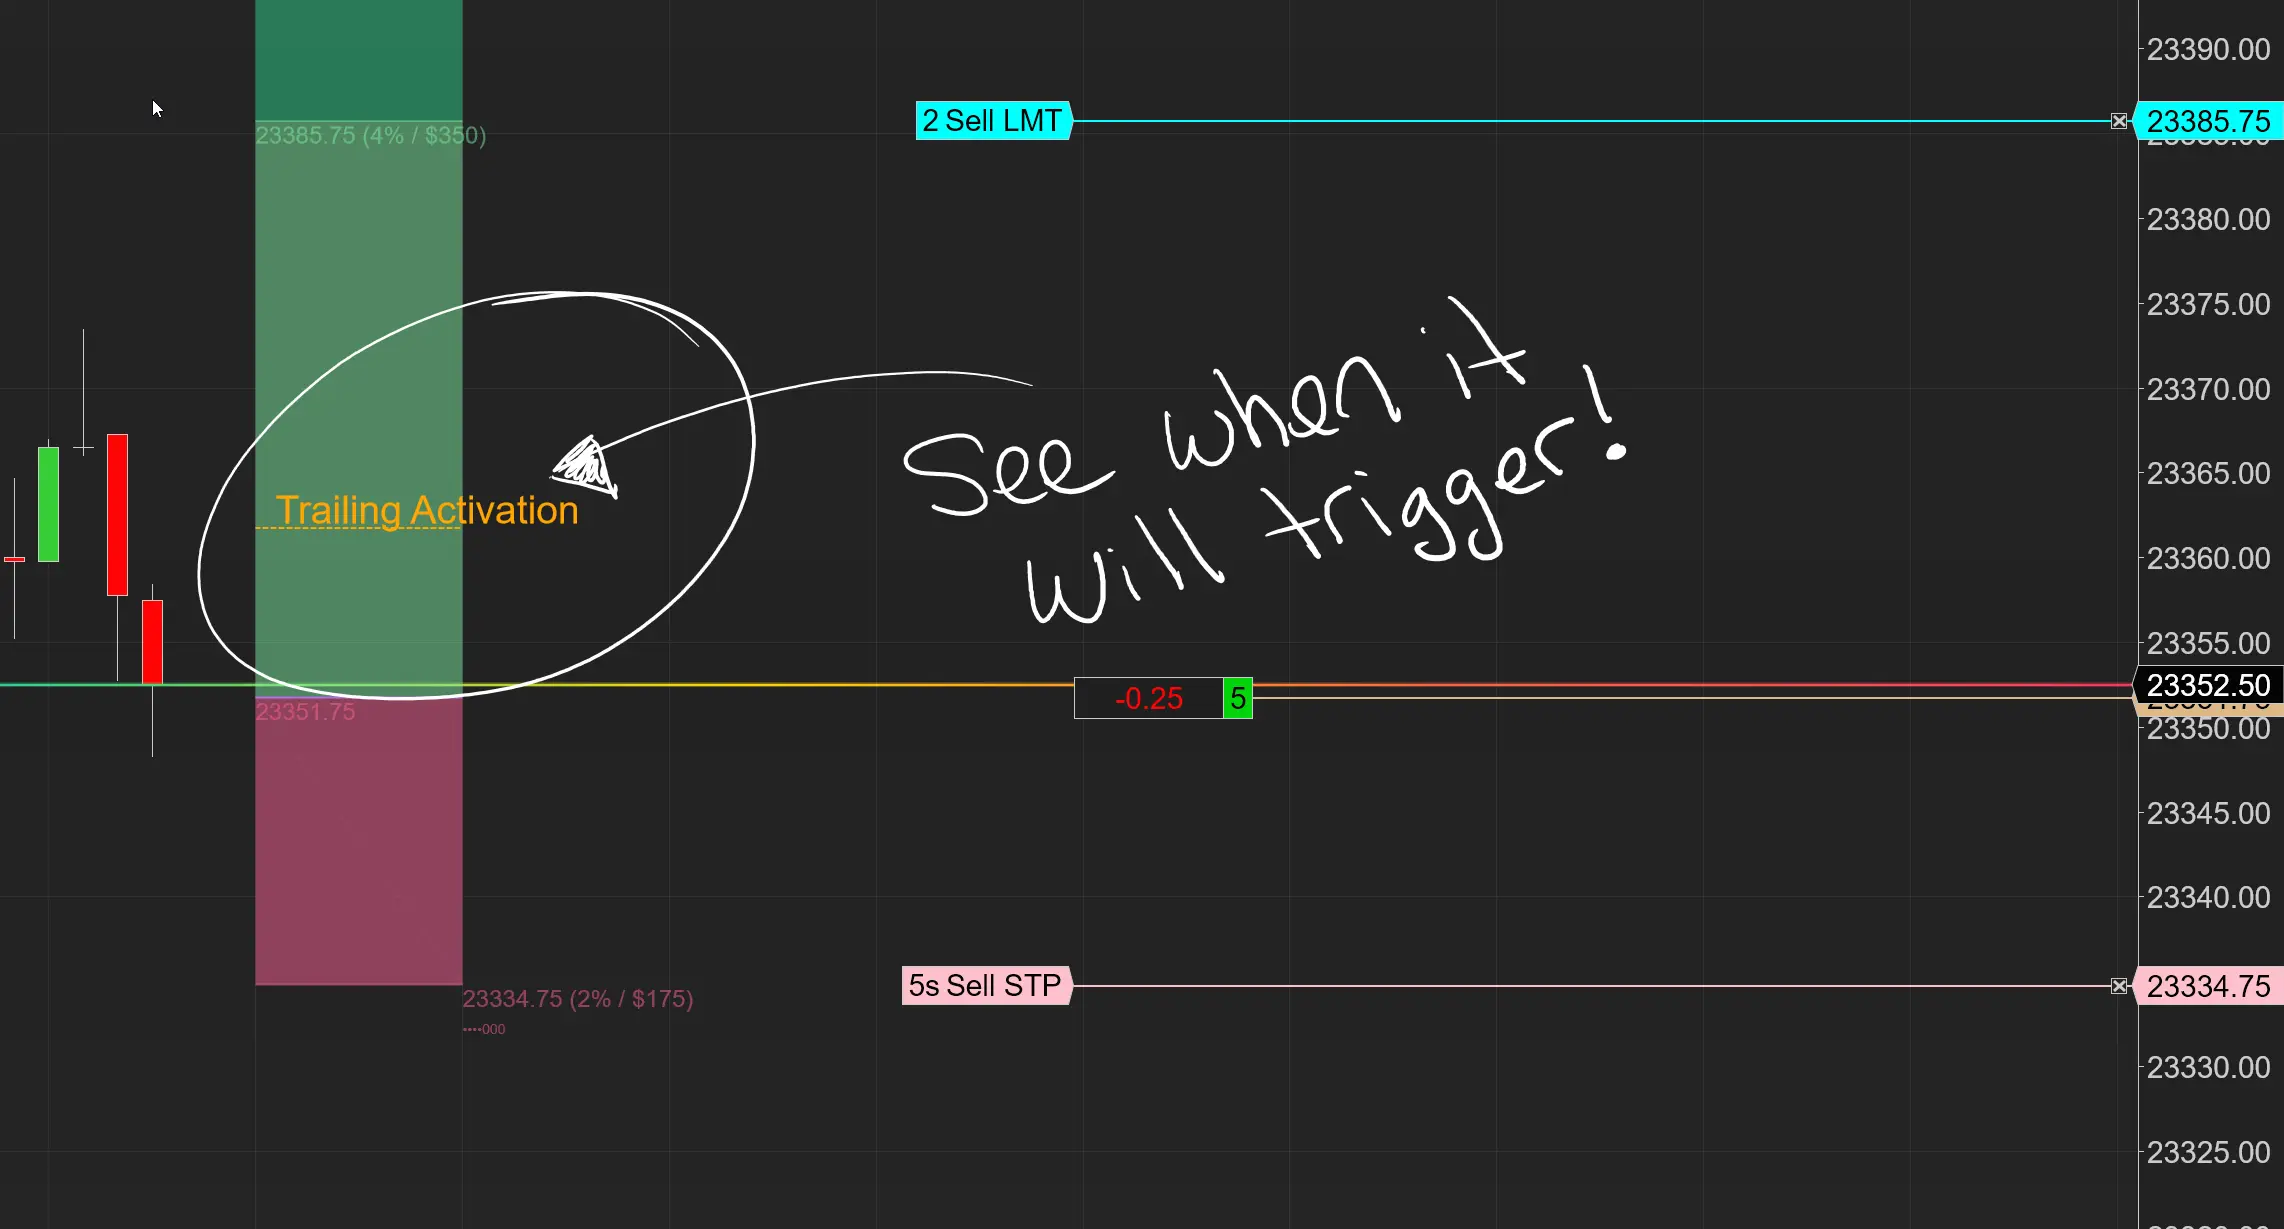
Dominate the Market with Smarter Trailing Stops in NinjaTrader
Jun. 17, 2025
Why Risking A Percentage of Your Account is Critical When Trading XABCD Patterns
May. 28, 2025
NinjaTrader 8.1.5 – They FINALLY Did It!
Apr. 30, 2025
Best ATM Strategy for NinjaTrader 8
Apr. 06, 2025
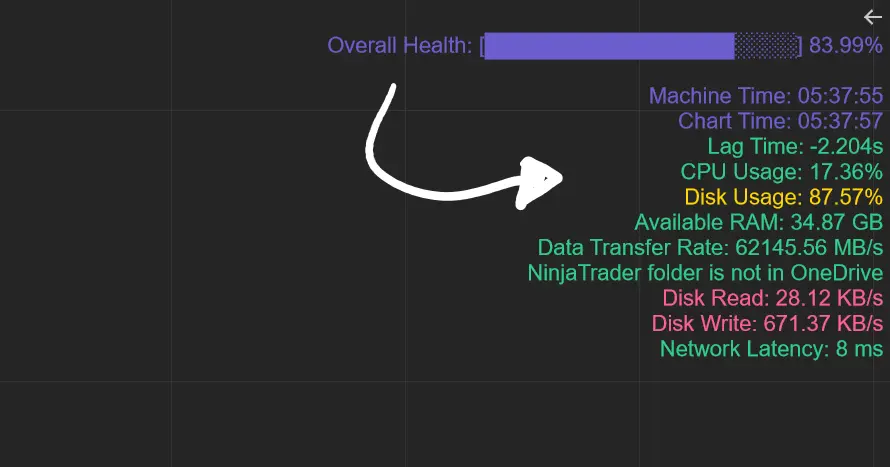
From Lag to Lightning: The Critical Role of Read/Write Speeds in NinjaTrader 8
Mar. 08, 2025


