XABCD Trading
Avoiding Costly Delays: How the XABCD Performance Indicator Identifies Lag Issues in Real-Time
What is "Lag" in Trading?
In the fast-moving world of trading, time is everything. Even a small delay, called “lag,” can change the outcome of a trade. For traders, lag means that orders might not go through as quickly as they should, leading to missed chances or less favorable prices. The XABCD Performance Indicator is built to spot lag as soon as it happens, giving traders a chance to act before delays cause problems. A certain amount of lag is expected and resonable. In this article, we’ll explain why lag is an issue in trading, how the XABCD Performance Indicator can help, and some unique ways it’s designed to fight lag.
Why Lag in Trading is a Problem
Lag is the delay between when you send a command and when it actually happens. In trading, even a few milliseconds can make a big difference. Here are some reasons why lag can hurt traders:
Delayed Orders: When there’s lag, trades don’t go through instantly. This means you might end up buying or selling at a price that’s worse than expected.
Missed Signals: Many traders rely on signals or indicators to decide when to enter or exit trades. Lag can cause signals to show up late, meaning traders make decisions based on old information.
Slippage: This happens when there’s a difference between the price you wanted and the price you actually got. Lag increases the risk of slippage since trades aren’t happening at the exact right time.
Increased Stress: Dealing with delays during trading can be frustrating and stressful. Traders want their systems to work smoothly and trust that everything is running as it should.
The XABCD Performance Indicator helps by watching for lag in real-time. This means traders are alerted right away if there are delays, so they can fix issues before it impacts their trades.

How the XABCD Performance Indicator Monitors Lag
In trading, timing is crucial. Delays, or “lag,” in your trading system can result in missed opportunities or losses. The XABCD Performance Indicator is specifically designed to detect and alert you to lag in real time, giving you the chance to act before delays disrupt your trades. To do this, the indicator tracks two essential times: Chart Time and Machine Time. Understanding these can help you better monitor your trading system’s health and performance.
Chart Time vs Machine Time
Chart Time: This is the time that’s stamped on each bar or tick of data within your trading platform. Chart time is based on the time associated with market data, so it reflects the time when each market event (like a trade or price change) occurs. For example, if you’re looking at a one-minute chart, each bar will have a chart time that represents the exact minute that bar was formed based on the market.
Machine Time: This is the actual time on your computer, which your operating system records and uses to keep your system in sync with the current time. Machine time reflects the time on your computer clock, which can sometimes differ from chart time due to factors like system performance or internet connection speed.
Machine Time: This is the actual time on your computer, which your operating system records and uses to keep your system in sync with the current time. Machine time reflects the time on your computer clock, which can sometimes differ from chart time due to factors like system performance or internet connection speed.
Together, chart time and machine time can reveal how efficiently data is moving through your trading system. By comparing the two, the XABCD Performance Indicator can detect delays that signal performance issues.
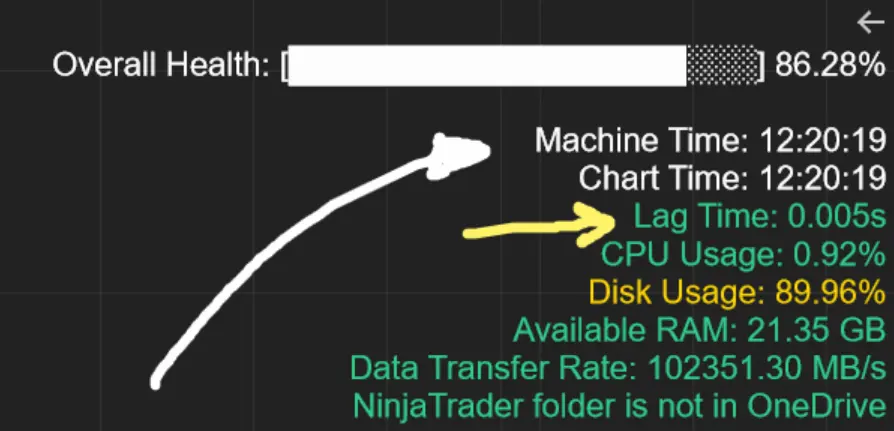
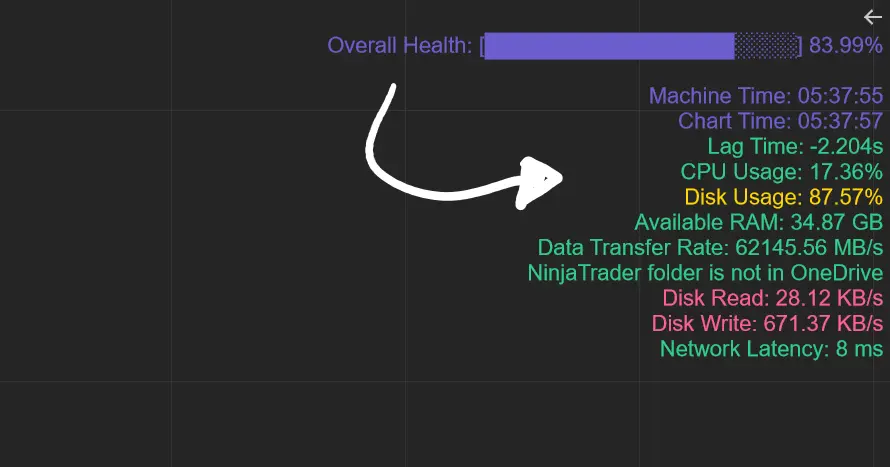
Below you can see our XABCD Pattern Suite runing with acceptable "green" lag which is at 0.005seconds. If you have an indicator that is causing a problem, your lag time will be in red (or yellow if on the edge).
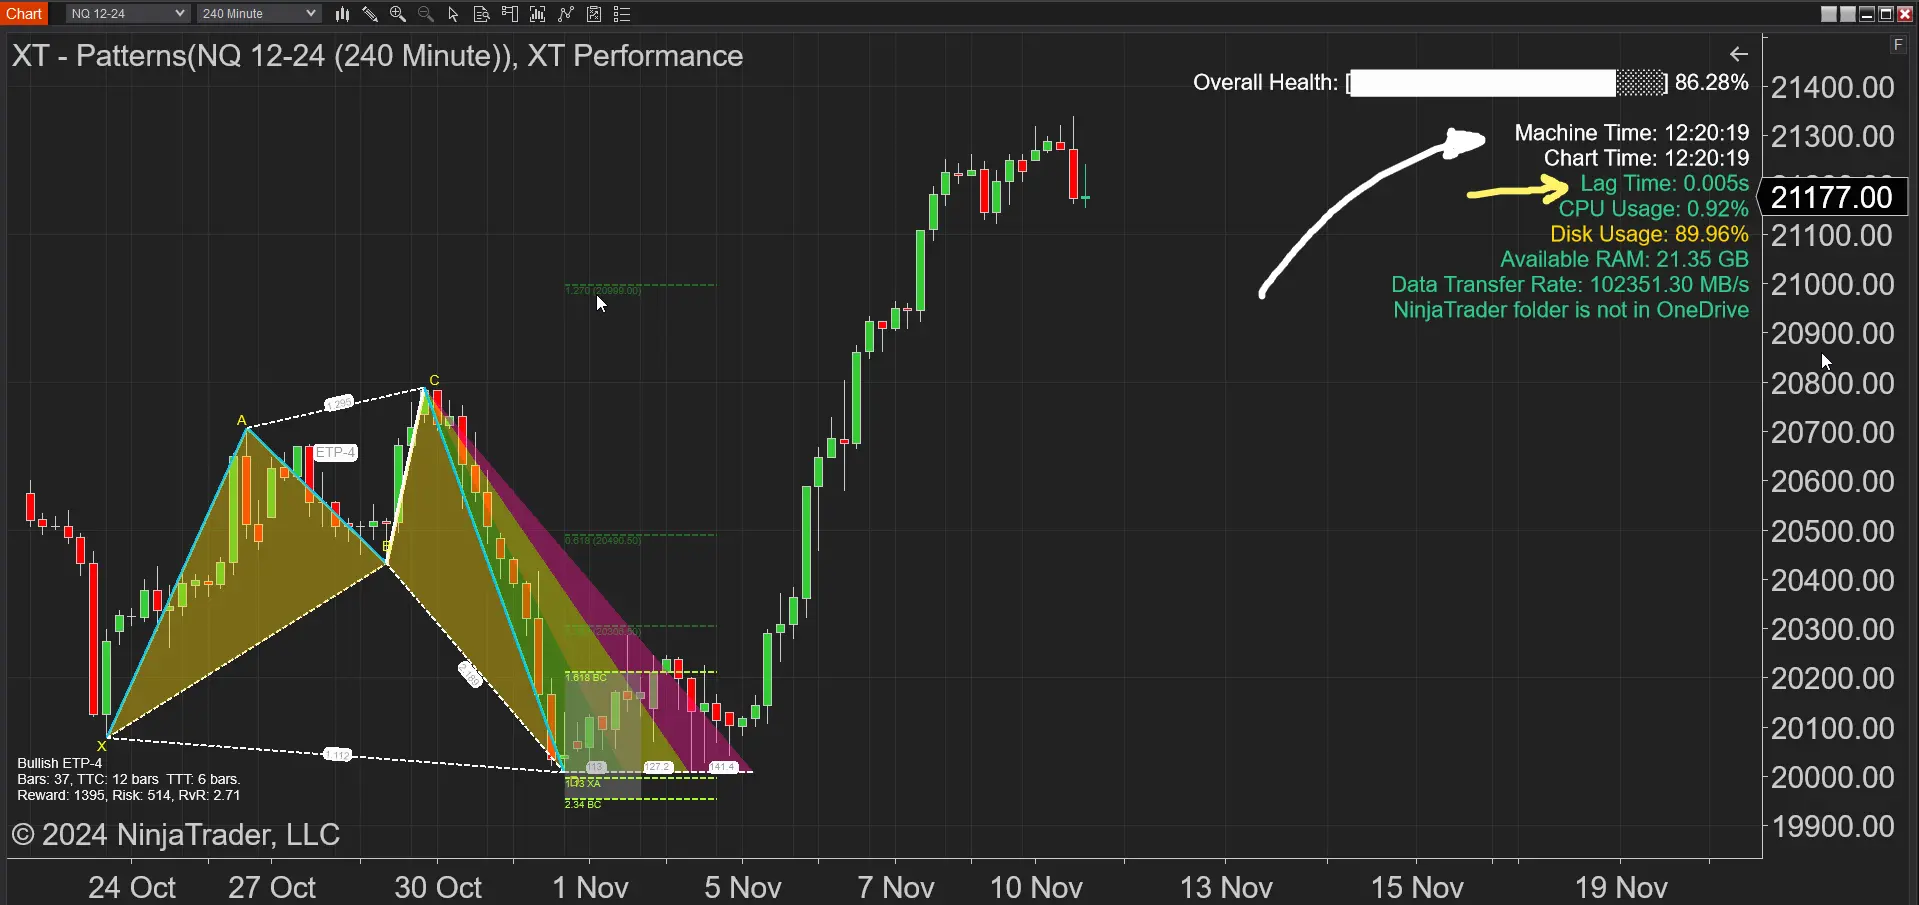

How We Calculate Lag?
Timestamp Comparison for Lag Detection
The indicator uses timestamps to compare the exact time of each bar (chart time) with the current time on your system clock (machine time). Here’s how it works: By calculating the difference between last chart time which is included in your data feed provider's data to you, and your machine time in milliseconds, the indicator determines how much lag there is. If the lag is above your set threshold, it triggers an alert.
Why the XABCD Performance Indicator is Essential for Traders
The XABCD Performance Indicator is a powerful tool for traders who want to avoid costly delays. By tracking the gap between chart time and machine time, setting customizable alerts, and keeping a history of lag events, this indicator provides everything traders need to monitor and manage their system’s performance. Here’s a quick summary of its key benefits:
Immediate Lag Detection: Real-time monitoring means you’ll know right away if your system is lagging, helping you act before it impacts your trades.
Customizable Settings:Set your own thresholds and alerts to match your trading strategy, giving you control over when and how you receive notifications.
Long-Term Insights:By keeping a history of lag events, the indicator helps you spot patterns and optimize your trading schedule.
The XABCD Performance Indicator’s approach of using chart time and machine time is a reliable way to monitor system health and avoid delays, allowing you to trade with confidence and precision.
How Do You Make NinjaTrader Run Faster?
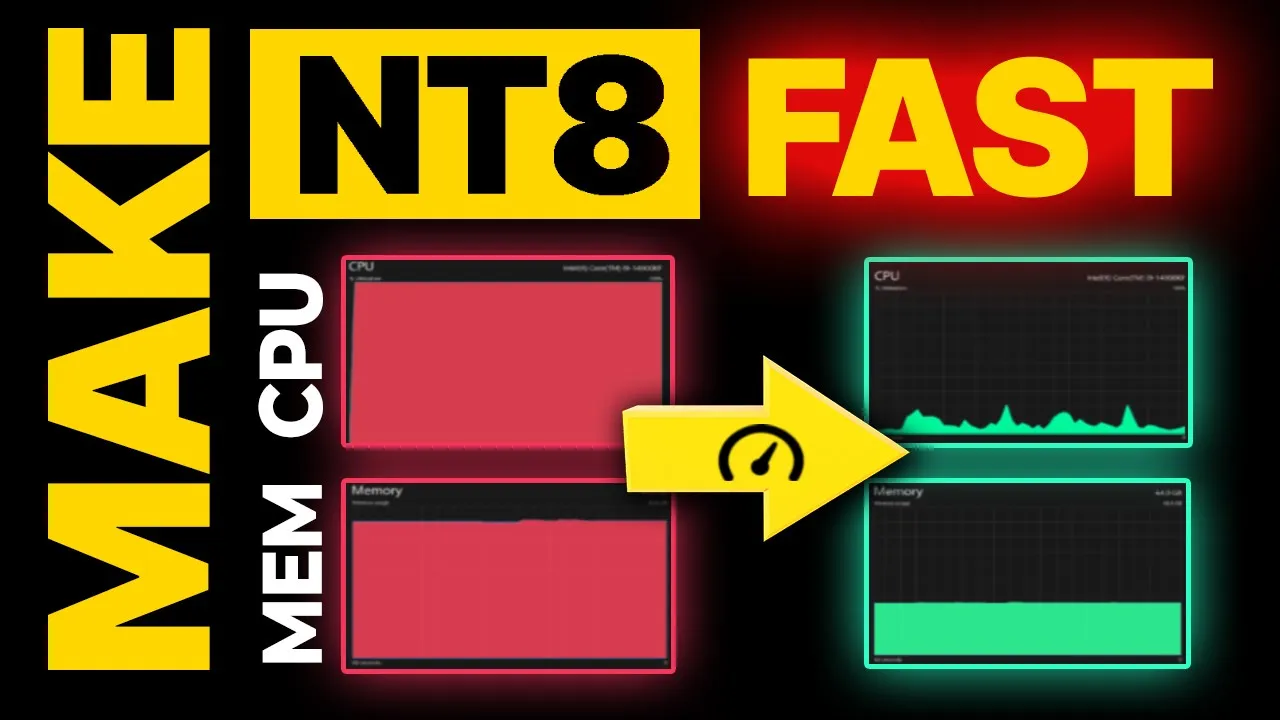
There is a list of about 10 things you can do right now to speed up NinjaTrader and your system in general. We did a video on this which you can find below. However, the performance of all these things will affect your CPU, RAM and probably your disk. All of these are monitored by your XABCD Performance Indicator.
- On Price Change (Do calculations when needed only)
- Days to Load (Only load the data you need)
- Upgrade your system
- Close Unused Workspaces
- Don't use old / updated indicators that code hasn't been kept up to date.
Sep. 28, 2025
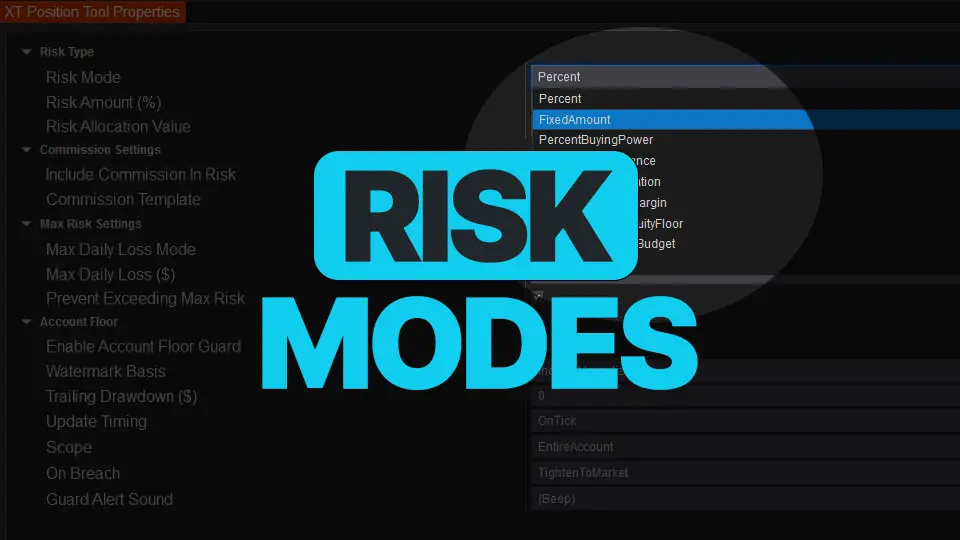
NinjaTrader Risk Management That Actually Moves the Needle
Sep. 25, 2025
NinjaTrader 8.1.6 — The “No Fluff” Tour (Speed, Clarity, Fewer Clicks)
Sep. 20, 2025
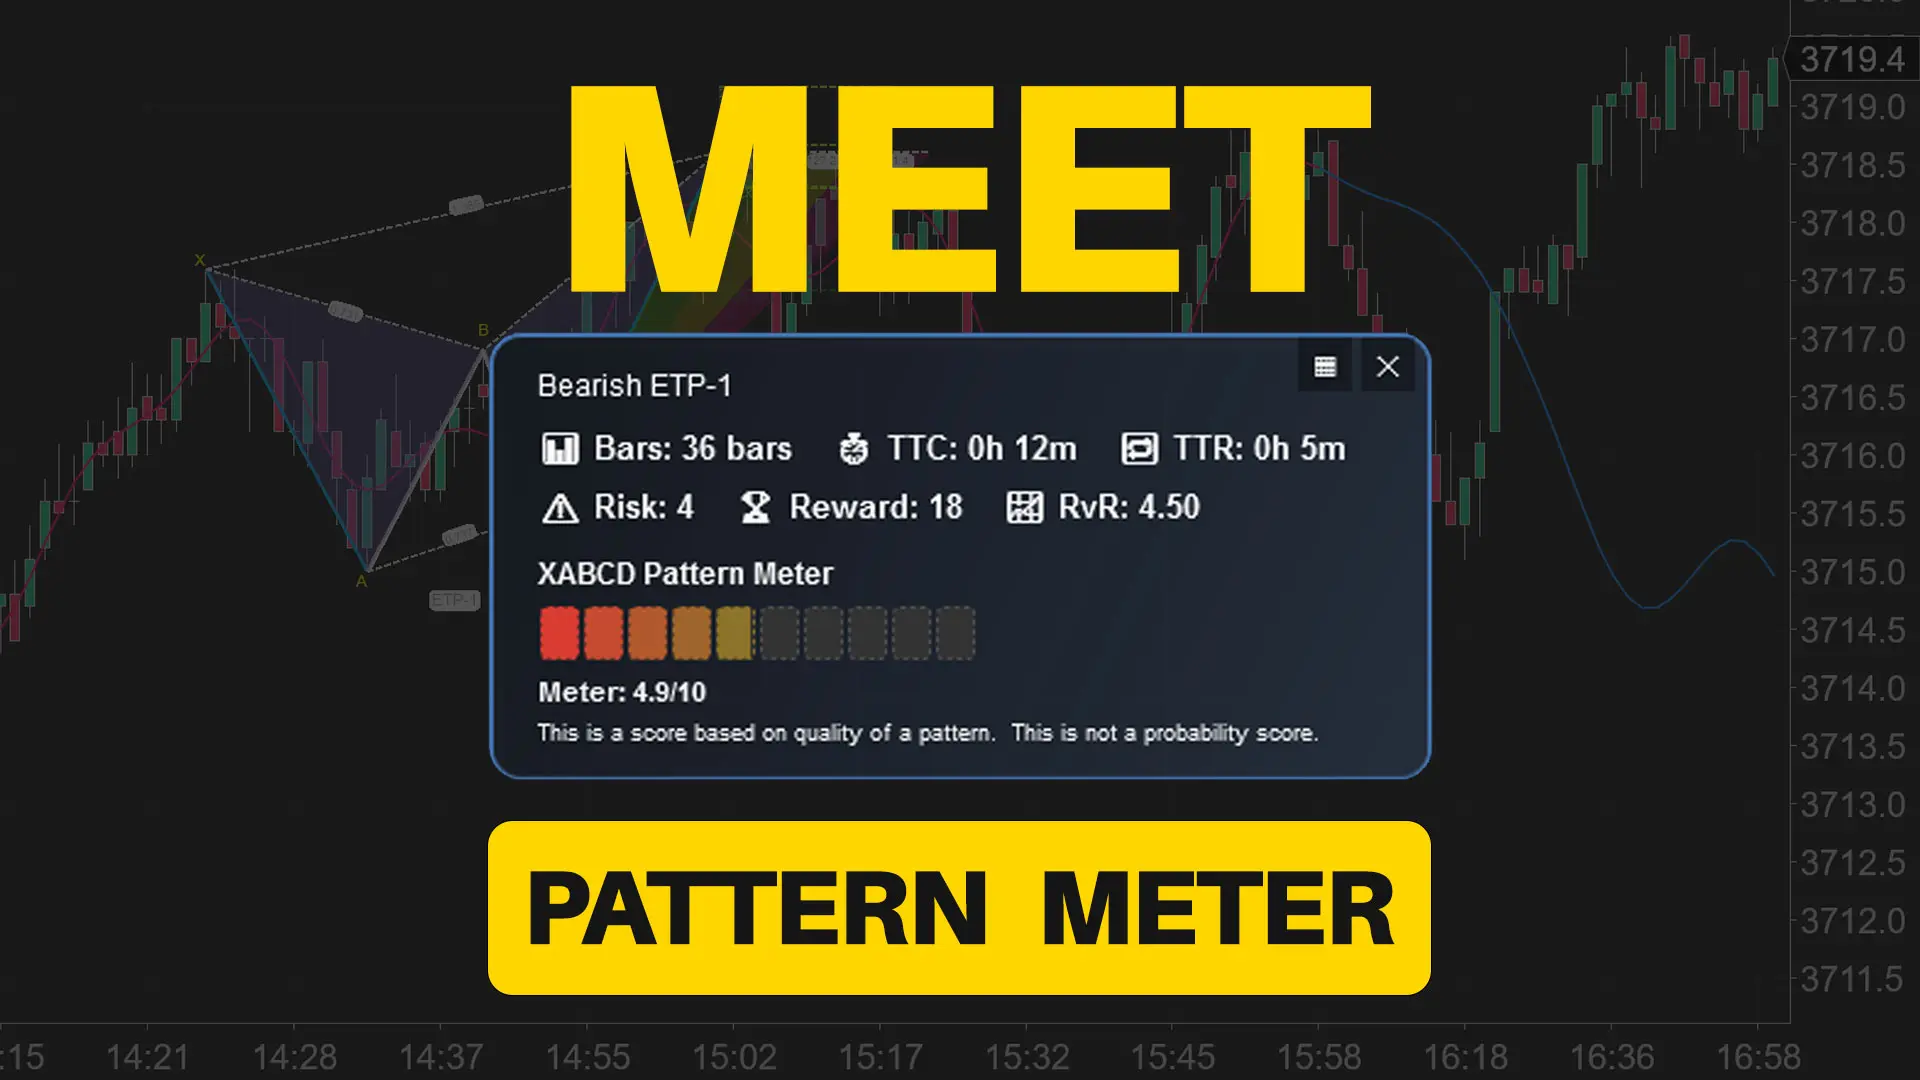
Meet the XABCD Pattern Meter (Real-Time Clarity)
Sep. 13, 2025
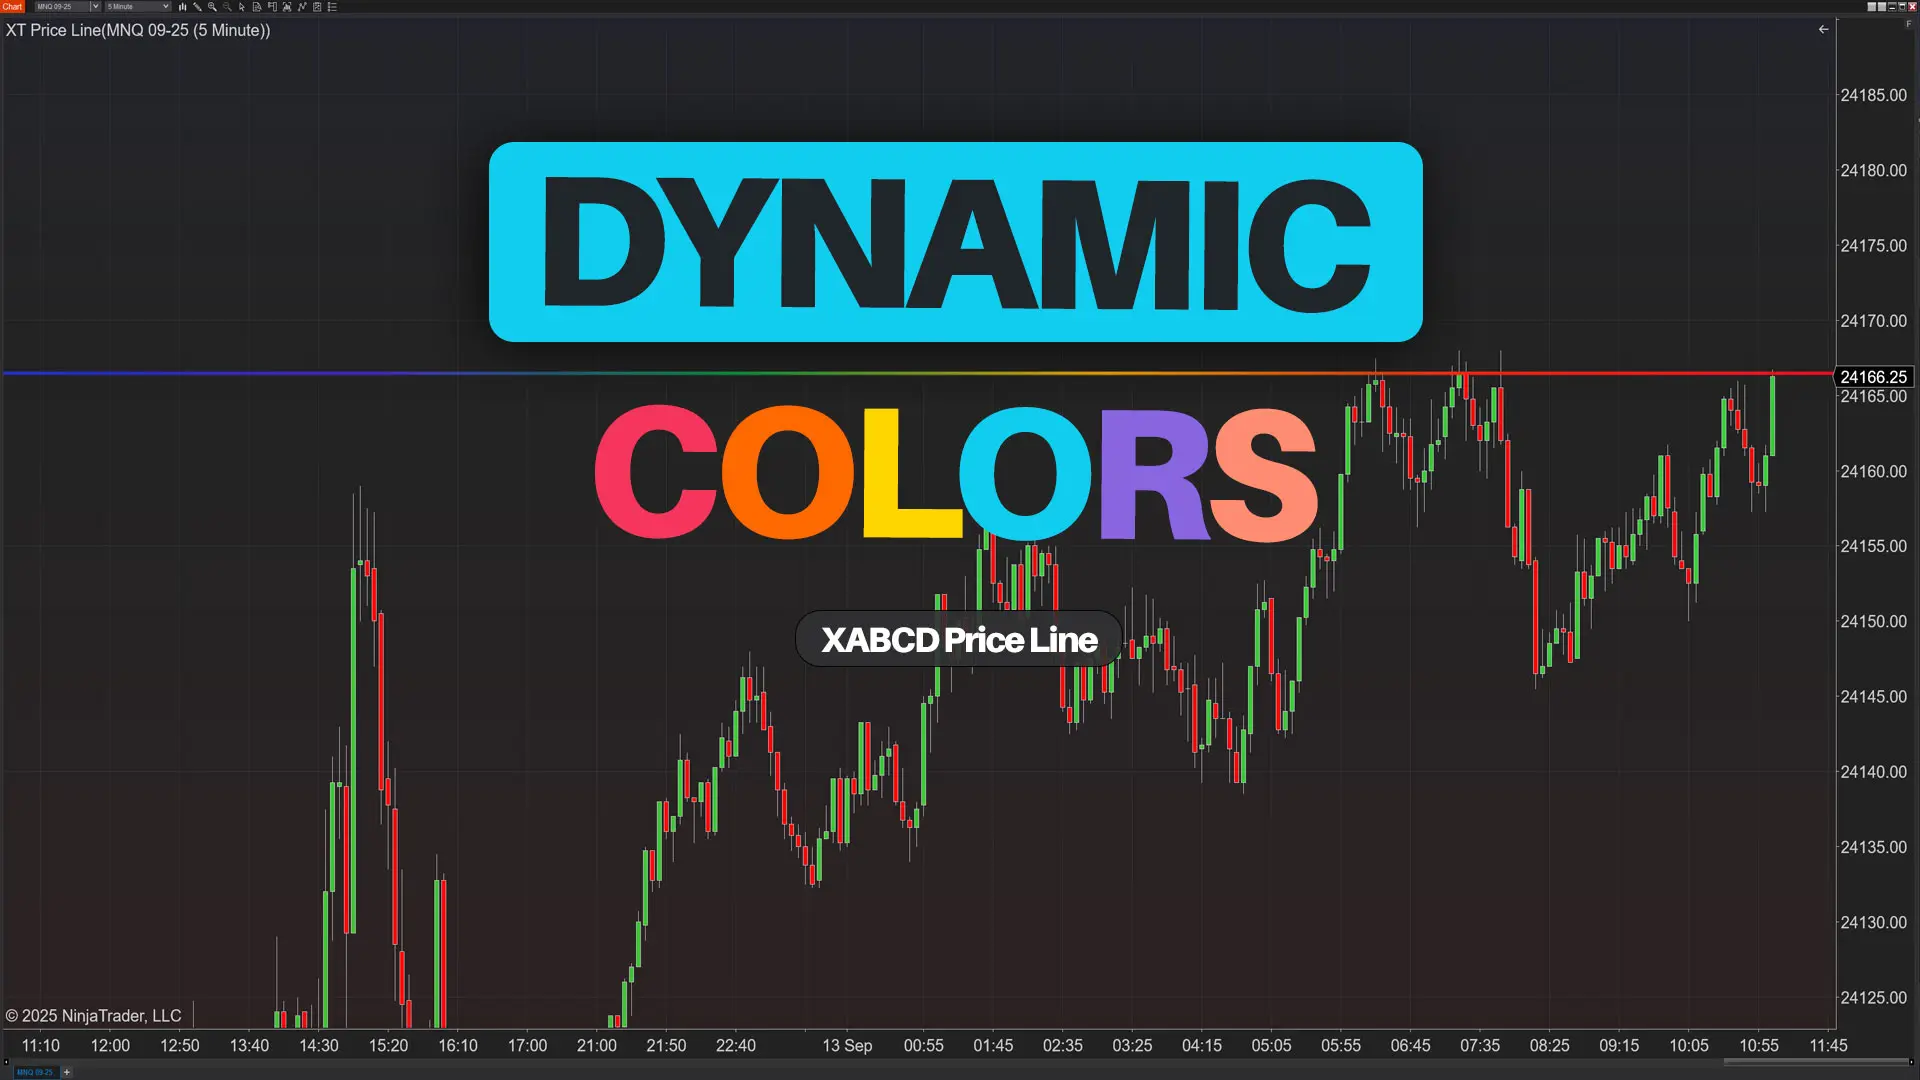
XT PriceLine: Dynamic Colors That Let You See Every Tick
Aug. 30, 2025
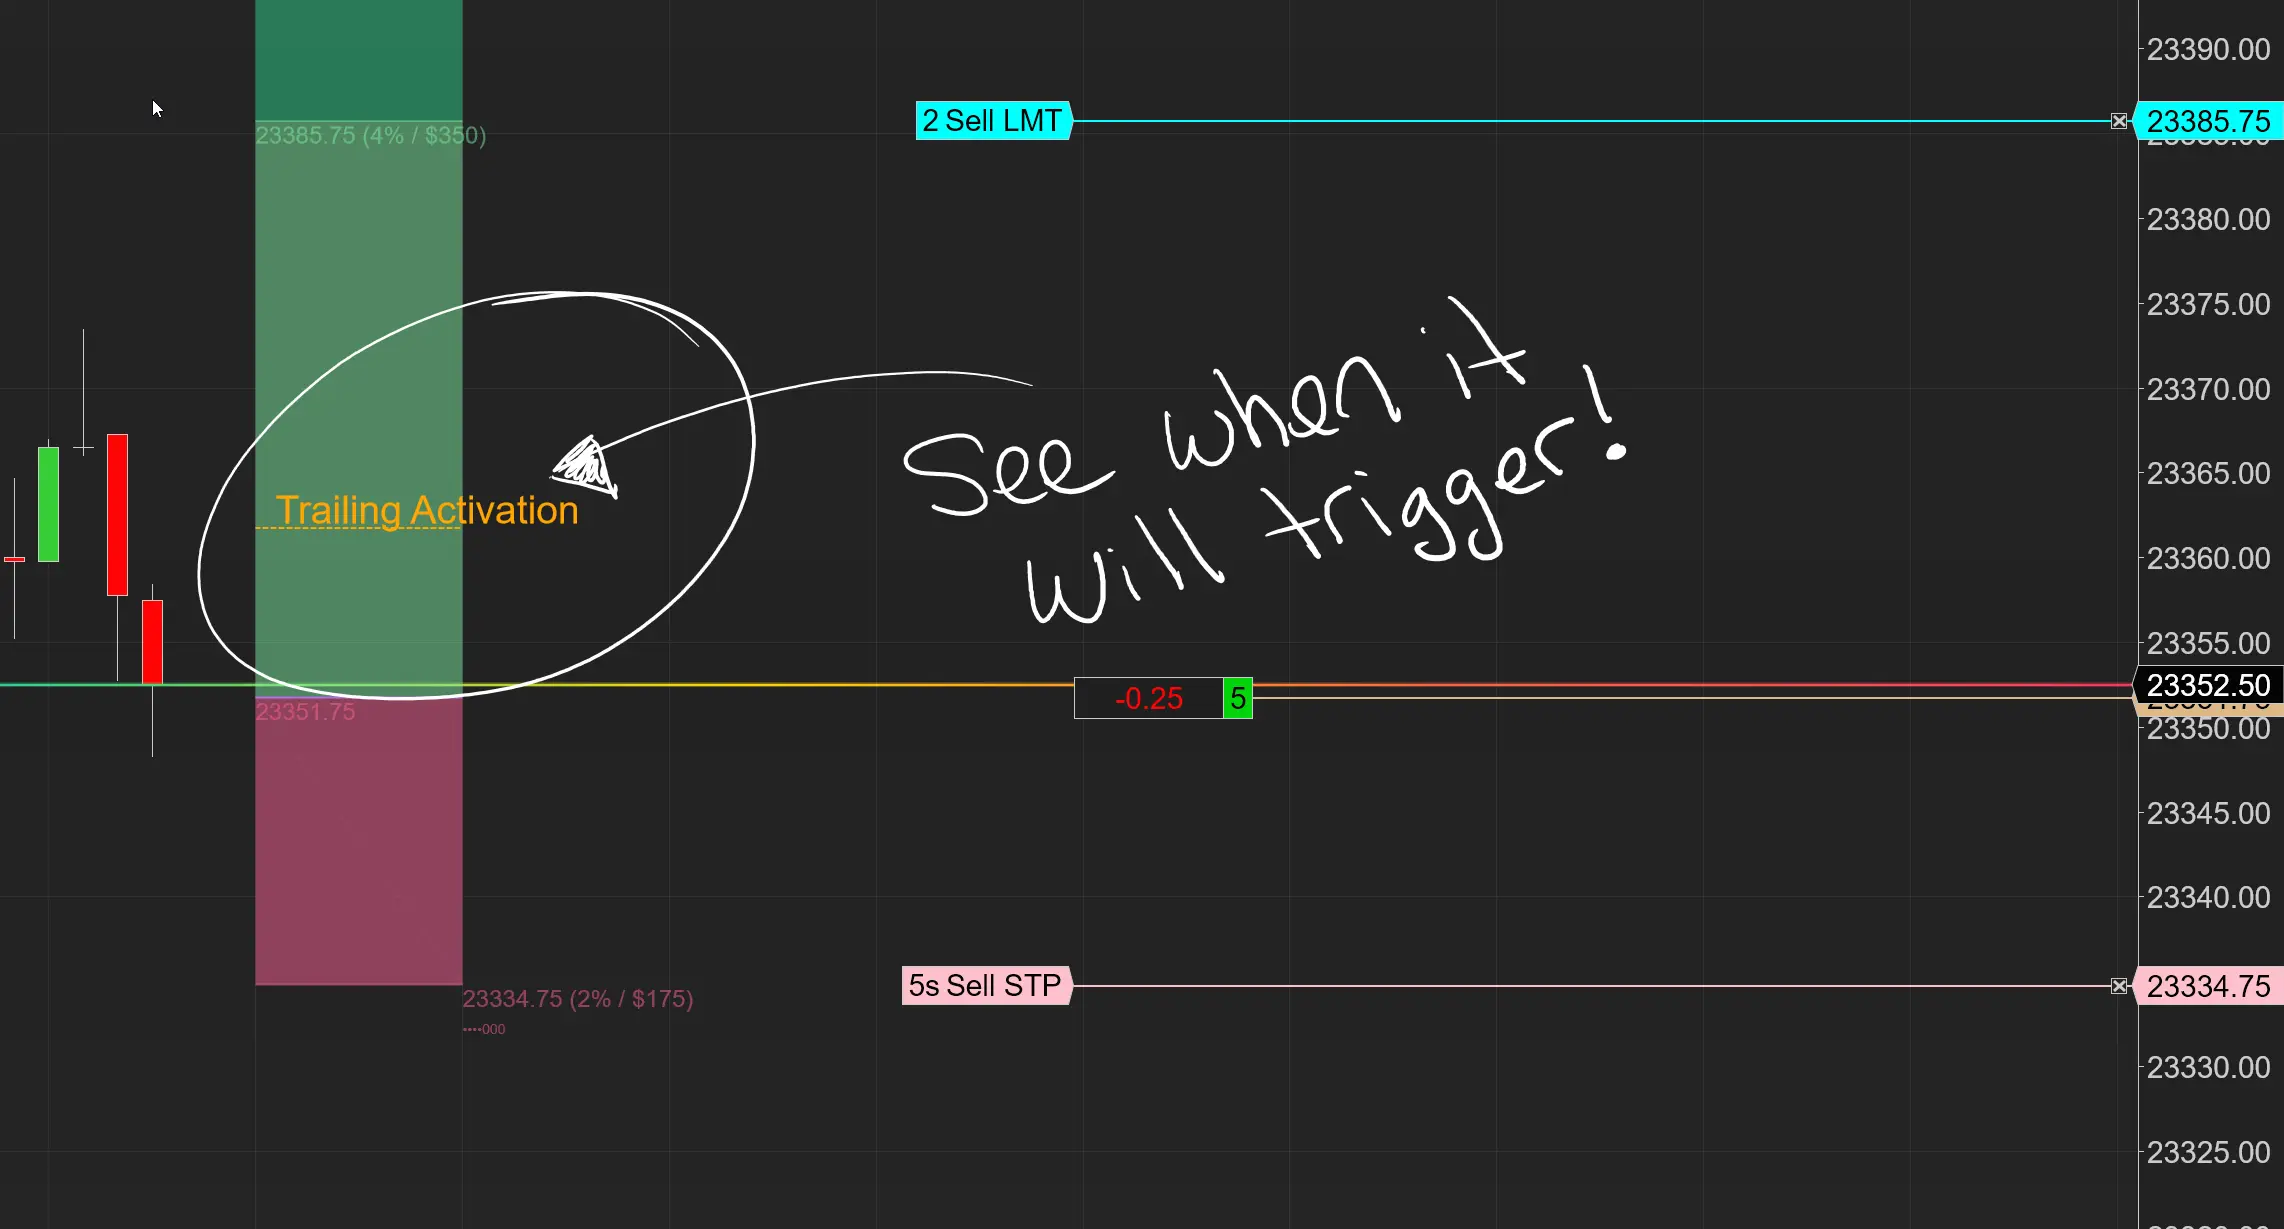
Dominate the Market with Smarter Trailing Stops in NinjaTrader

Jun. 17, 2025
Why Risking A Percentage of Your Account is Critical When Trading XABCD Patterns

May. 28, 2025
NinjaTrader 8.1.5 – They FINALLY Did It!
Apr. 30, 2025
Best ATM Strategy for NinjaTrader 8
Apr. 06, 2025
From Lag to Lightning: The Critical Role of Read/Write Speeds in NinjaTrader 8
Mar. 08, 2025


