XABCD Trading
XABCD Performance™ Indicator for NinjaTrader 8
XABCD Performance
Is Your Trading Platform Empowering You or Holding You Back?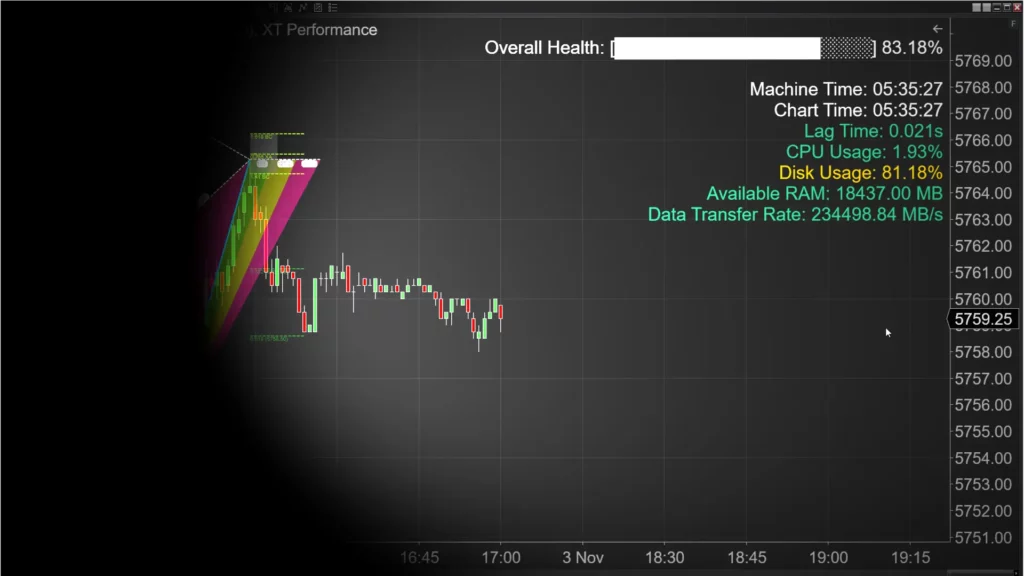
Master Your Performance Like Never Before
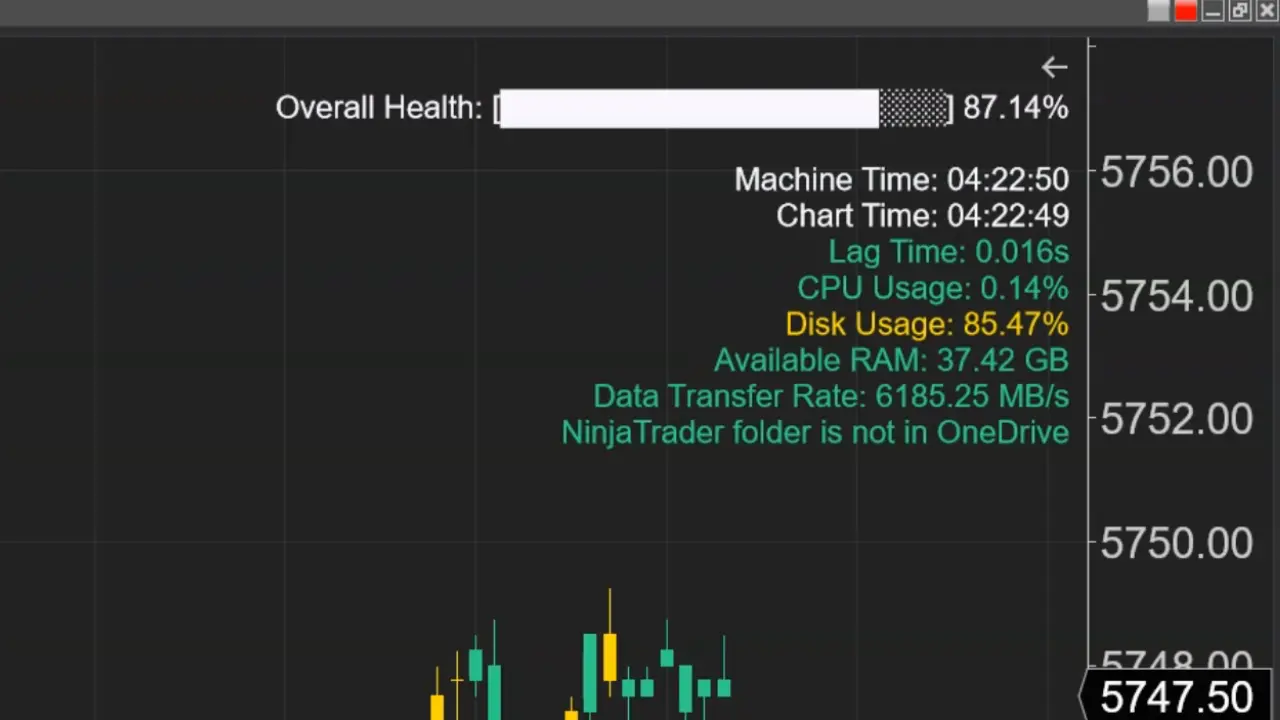
Real-Time Lag Monitoring at Your Fingertips
Take charge of your trading performance by understanding real-time lag between chart data and your machine. Our indicator provides a clear display of lag, empowering you to be precise and proactive, not reactive.
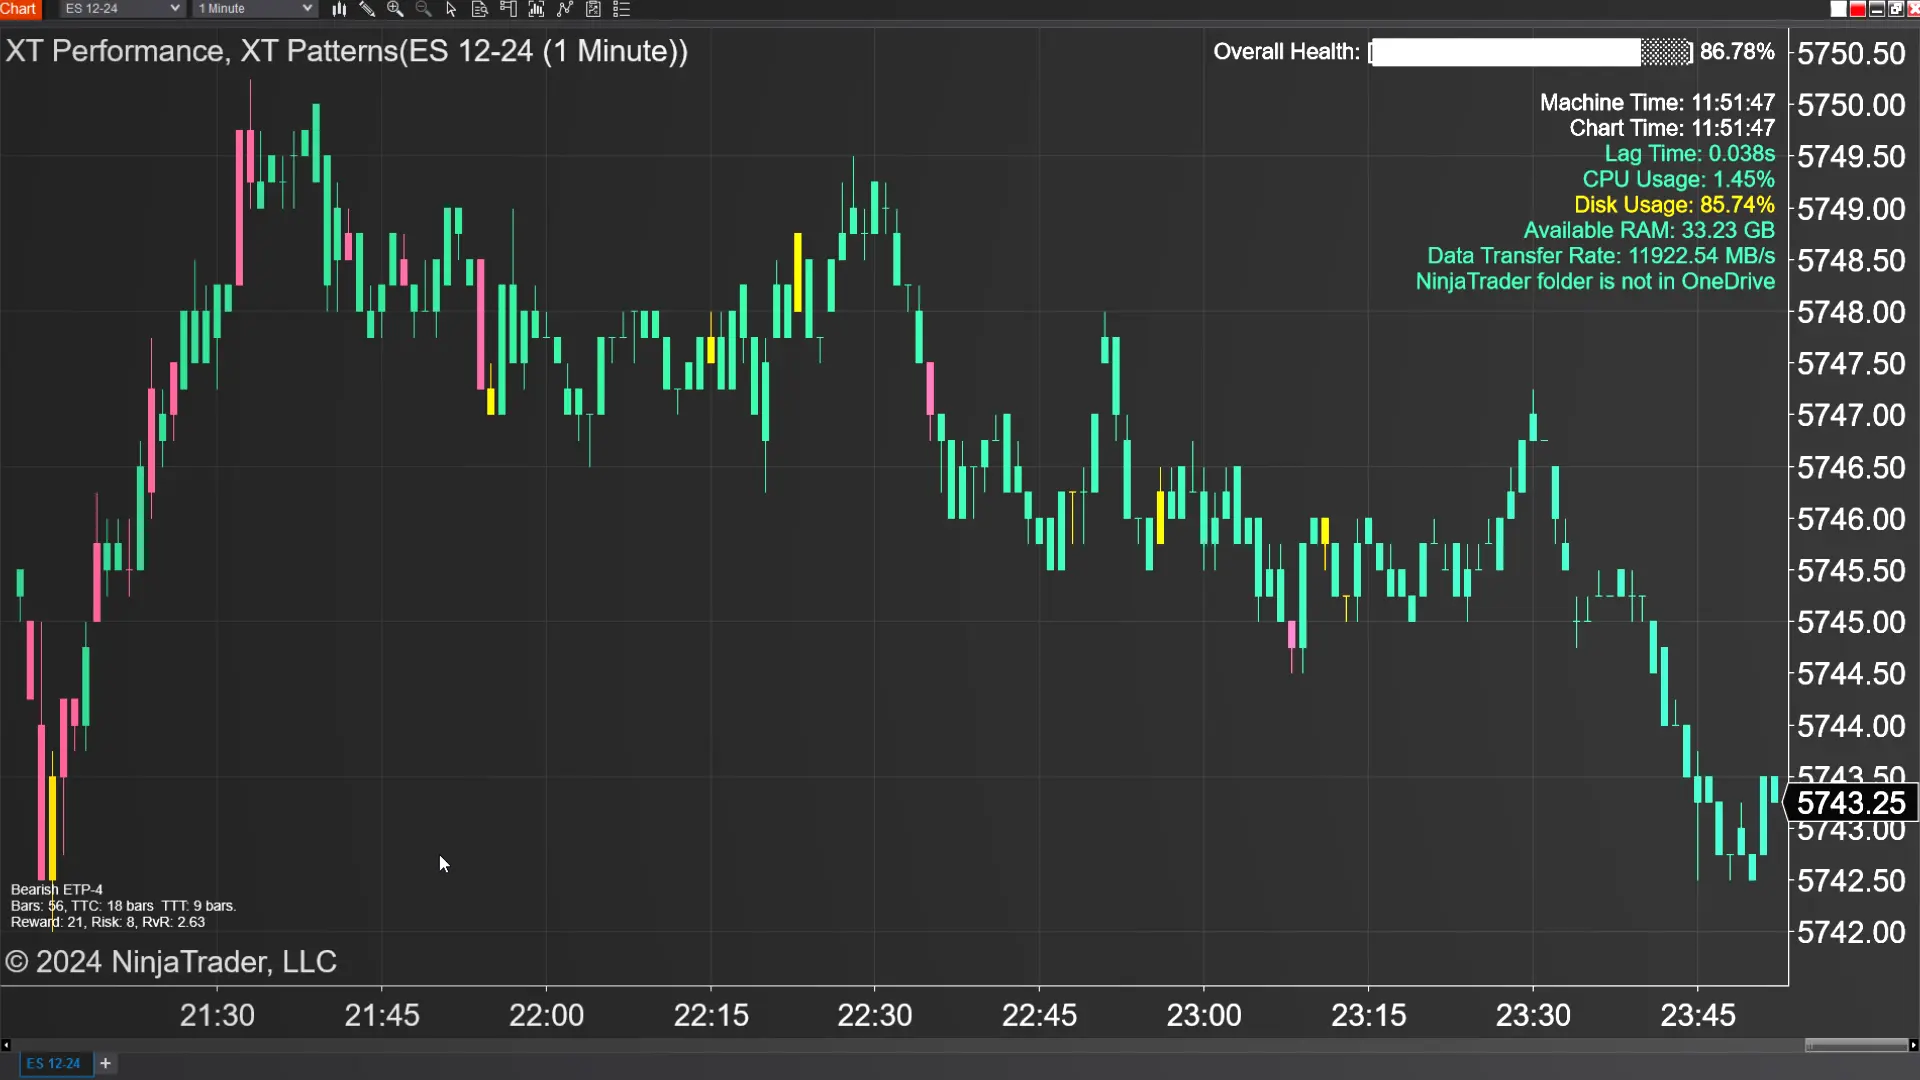
Historical Lag Visualization: This super cool feature allows you to see where your chart has experianced past lag. All candlesticks will change color depending on their lag history during that bar. It's a great way to come back to your charts to see where any lag might have happened.
See it in Action
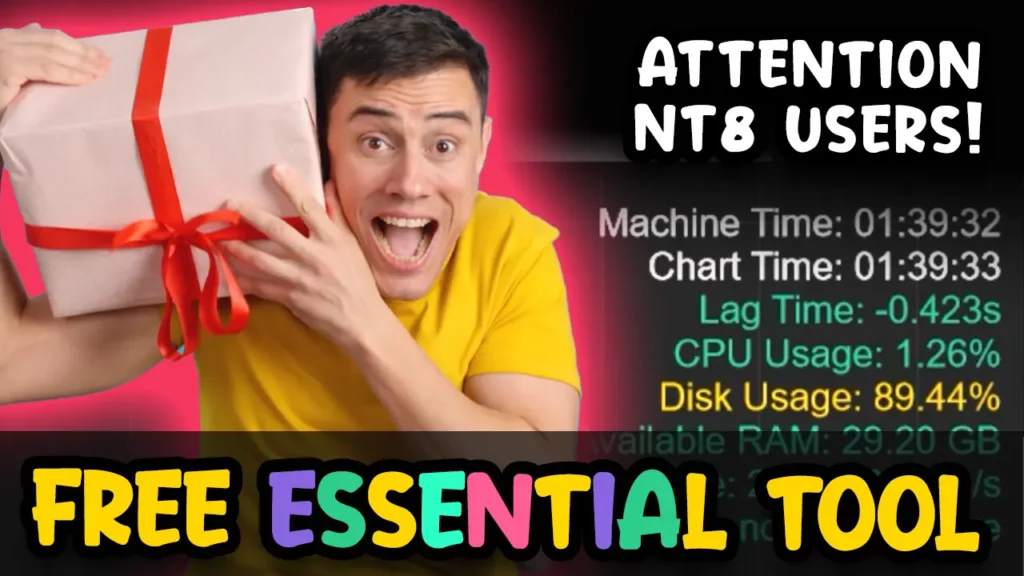
Run Time: 4min 31sec
Visual Feedback
Color-Coded Alerts to Make Split-Second Decisions
Alerts are useless if they don't guide you towards action. This indicator utilizes color-coded lag thresholds—green for good, yellow for caution, and red for danger—so you know exactly where you stand, every second of the way.
Green means we're running with optimal performance. Everything is running OK.
Yellow is a warning and should be looked into as it could be effecting performance.
Red means danger and we should certainly be needing your attention.
Tailored Alerts on Your Terms
With adjustable parameters like update frequency, font size, and alert sound, you stay in control. Your experience is as unique as your trading style. Set things up just the way you need them to match your flow and reduce distraction.
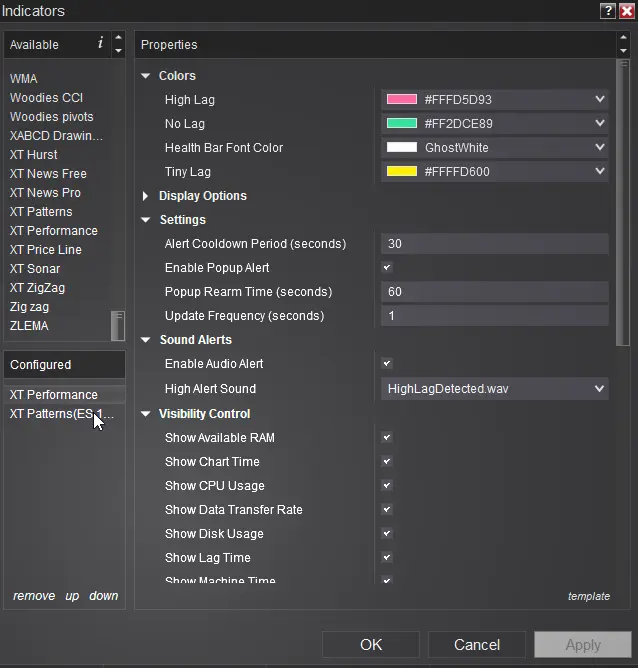
Turn on "Lag Bars" History
This is a super cool feature that lets you see a history of any lag that could be happening. You're probably going to turn this on while you're away from the machine to see if any lag is happening throughout the period.
Red bars that have contained high lag.
Yellow bars have a warning level amount of lag.
Green bars have acceptable/no lag.
Track Specs Like a Pro
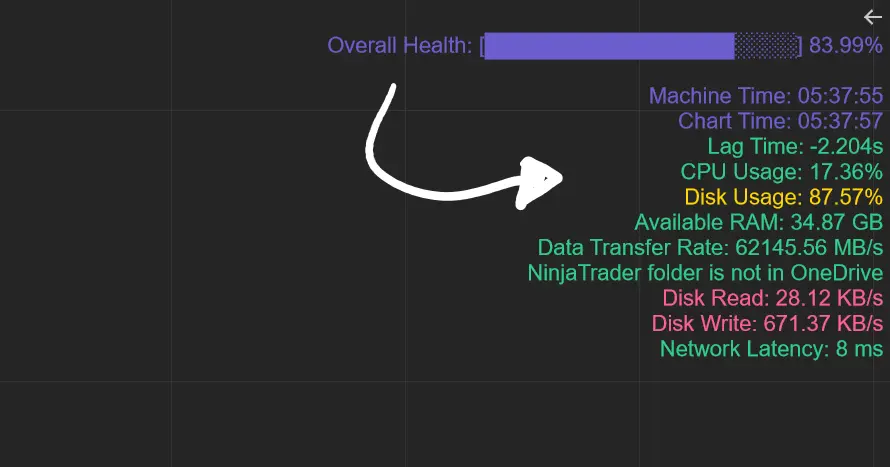
Trading isn't just about data on the screen—it's about the health of your system. Real-time updates on CPU load, memory, and network provide you with a full picture. A problem ignored becomes a problem realized—stay ahead of them.
Live Market Performance Score
What Is Your Score?
In trading, precision and reliability are non-negotiable. You need a tool that doesn’t just respond to issues—it foresees them, guides you, keeps your system in check. That’s where our Overall Health Representation Score steps in. Imagine having a single, clear metric that tells you the real-time strength of your system’s core functions: CPU load, memory availability, disk space, and network performance—all distilled into one actionable score.
This isn’t just data; it’s your edge. With our health score, you gain instant insight into the stability of your setup, allowing you to make confident decisions without worrying if your system will keep up. When the stakes are high, this score becomes your trusted benchmark, warning you of any strain before it affects performance. It’s more than a feature—it’s your safeguard, a tool that empowers you to stay in control, trading at your best with every critical second accounted for.
Free
Take Control. Get Your Health Score.
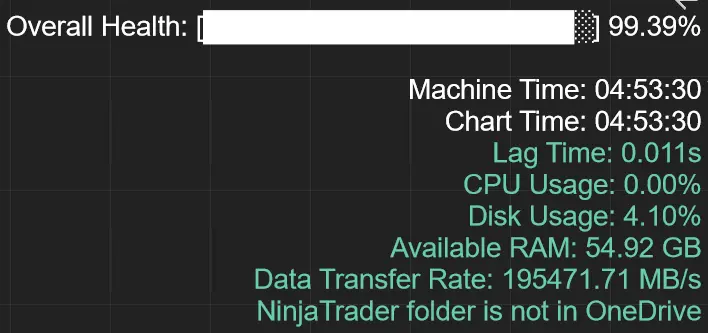
Highest Score - Can You Beat It?
Congrats, Marc!Think you can beat him? Email us a screenshot or send it to us on the live chat!
Second Place - Tom, Fantastic Score!
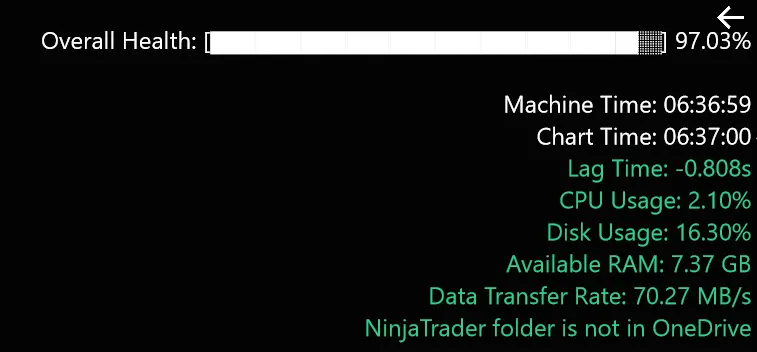
Third Place - Ryan, Great Job!
